 Exposing $4.7 Trillion Annually in Undervalued Information
Something strange began to happen with company valuations beginning twenty to thirty years ago. Book values increasingly began to diverge — go lower — from stock prices or acquisition prices. Between 1982 and 1992 the ratio of book value to market value decreased from 62% to 38% for public US companies [1]. The why of this mystery has largely been solved, but what to do about it has not. Significantly, semantic technologies and approaches offer both a rationale and an imperative for how to get the enterprises’ books back in order. In the process, semantics may also provide a basis for more productive management and increased valuations for enterprises as well.
The mystery of diverging value resides in the importance of information in an information economy. Unlike the historical and traditional ways of measuring a company’s assets — based on the tangible factors of labor, capital, land and equipment — information is an intangible asset. As such, it is harder to see, understand and evaluate than other assets. Conventionally, and still the more common accounting practice, intangible assets are divided into goodwill, legal (intellectual property and trade secrets) and competitive (know-how) intangibles. But — given that intangibles now equal or exceed the value of tangible assets in advanced economies — we will focus instead on the information component of these assets.
As used herein, information is taken to be any data that is presented in a form useful to recipients (as contrasted to the more technical definition of Shannon and Weaver [2]). While it is true that the there is always a question of whether the collection or development of information is a cost or represents an investment, that “information” is of growing importance and value to the enterprise is certain.
The importance of this information focus can be demonstrated by two telling facts, which I elaborate below. First, only five to seven percent of existing information is adequately used by most enterprises. And, second, the global value of this information amounts to perhaps a range of $2.0 trillion to $7.4 trillion annually (yes, trillions with a T)! It is frankly unbelievable that assets of such enormous magnitude are so poorly understood, exploited or managed.
Amongst all corporate resources and assets, information is surely the least understood and certainly the least managed. We value what we measure, and measure what we value. To say that we little measure information — its generation, its use (or lack thereof) or its value — means we are attempting to manage our enterprises with one eye closed and one arm tied behind our backs. Semantic approaches offer us one way, perhaps the best way, to bring understanding to this asset and then to leverage its value.
The Seven “Laws” of Information
More than a decade ago Moody and Walsh put forward a seminal paper on the seven “laws” of information [3]. Unlike other assets, information has some unique characteristics that make understanding its importance and valuing it much more difficult than other assets. Since I think it a shame that this excellent paper has received little attention and few citations, let me devote some space to covering these “laws”.
Like traditional factors of production — land, labor, capital — it is critical to understand the nature of this asset of “information”. As the laws below make clear, the nature of “information” is totally unique with respect to other factors of production. Note I have taken some liberty and done some updating on the wording and emphasis of the Moody and Walsh “laws” to accommodate recent learnings and understandings.
Law #1: Information Is (Infinitely) Shareable
Information is not friable and can not be depleted. Using or consuming it has no direct affect on others using or consuming it and only using portions of it does not undermine the whole of it. Using it does not cause a degradation or loss of function from its original state. Indeed, information is actually not “consumed” at all (in the conventional sense of the term); rather, it is “shared”. And, absent other barriers, information can be shared infinitely. The access and
use to information on the Web demonstrates this truth daily.
Thus, perhaps the most salient characteristic of information as an asset is that it can be shared between any number of people, business areas and organizations without loss of value to any party (absent the importance of confidentiality or secrecy, which is another information factor altogether). The sharability or maintenance of value irrespective of use makes information quite different to how other assets behave. There is no dilution from use. As Moody and Walsh put it, “from the firm’s perspective, value is therefore cumulative rather than apportioned across different users.”
In practice, however, this very uniqueness is also a cause of other organizational challenges. Both personal and institutional barriers get erected to limit sharing since “knowledge is power.” One perverse effect of information hoarding or lack of institutional support for sharing is to force the development anew of similar information. When not shared, existing information becomes a cost, and one that can get duplicated many times over.
Law #2: The Value of Information Increases With Use
Most resources degrade with use, such as equipment wearing out. In contrast, the per unit value of information increases with use. The major cost of information is in its capture, storage and maintenance. The actual variable costs of using the information (particularly digital information) is, in essence, zero. Thus, with greater use, the per unit cost of information drops.
There is a corollary to this that also goes to the heart of the question of information as an asset. From an accounting point of view, something can only be an asset if it provides future economic value. If information is not used, it cannot possibly result in such benefits and is therefore not an asset. Unused information is really a liability, because no value is extracted from it. In such cases the costs of capture, storage and maintenance are incurred, but with no realized
value. Without use, information is solely a cost to the enterprise.
The additional corollary is that awareness of the information’s existence is an essential requirement in order to obtain this value. As Moody and Walsh state, “information is at its highest ‘potential’ when everyone in the organization knows where it is, has access to it and knows how to use it. Information is at its lowest ‘potential’ when people don’t even know it is there.”
A still further corollary is the importance of information literacy. Awareness of information without an understanding of where it fits or how to take advantage of it also means its value is hidden to potential users. Thus, in addition to awareness, training and documentation are important factors to help ensure adequate use. Both of these factors
may seem like additional costs to the enterprise beyond capture, storage and maintenance, but — without them — no or little value will be leveraged and the information will remain a sunk cost.
Law #3: Information is Perishable
Like most other assets, the value of information tends to depreciate over time [4]. Some information has a short shelf life (such as Web visitations); other has a long shelf life (patents, contracts and many trade secrets). Proper valuation of information should take into account such differences in operational life, analysis or decision life, and statutory life. Operational shelf life tends to be the shortest.
In these regards, information is not too dissimilar from other asset types. The most important point is to be cognizant of use and shelf differences amongst different kinds of information. This consideration is also traded off against the declining costs of digital information storage.
Law #4: The Value of Information Increases With Accuracy
A standard dictum is that the value of information increases with accuracy. The caveat, however, is that some information, because it is not operationally dependent or critical to the strategic interests of the firm, actually can become a cost when capture costs exceed value. Understanding such Pareto principles is an important criterion in evaluating information approaches. Generally, information closest to the transactional or business purpose of the organization will demand higher accuracy.
Such statements may sound like platitudes — and are — in the absence of an understanding of information dependencies within the firm. But, when certain kinds of information are critical to the enterprise, it is just as important to know the accuracy of the information feeding that “engine” as it is for oil changes or maintenance schedules for physical engines. Thus an understanding of accuracy requirements in information should be a deliberate management focus for critical business functions. It is the rare firm that attends to such imperatives today.
Law #5: The Value of Information Increases in Combination
A unique contribution from semantic approaches — and perhaps the one resulting in the highest valuation benefit — arises from the increased value of connecting the information. We have come to understand this intimately as the “network effect” from interconnected nodes on a network. It also arises when existing information is connected as well.
Today’s enterprise information environment is often described by many as unconnected “silos”. Scattered databases and spreadsheets and other information repositories litter the information landscape. Not only are these sources unconnected and isolated, but they also may describe similar information in different and inconsistent ways.
As I have described previously in The Law of Linked Data [5], existing information can act as nodes that — once connected to one another — tend to produce a similar network effect to what physical networks exhibit with increasing numbers of users. Of course, the nature of the information that is being connected and its centrality to the mission of the enterprise will greatly affect the value of new connections. But, based on evidence to date, the value of information appears to go up somewhere between a quadratic and exponential function for the number of new connections. This value is especially evident in know-how and competitive areas.
Law #6: More Is Not Necessarily Better
Information overload is a well-known problem. On the other hand, lack of appropriate information is also a compelling problem. The question of information is thus one of relevancy. Too much irrelevant information is a bad thing, as is too little relevant information.
These observations lead to two use considerations. First, means to understand and focus information capture on relevant information is critical. And, second, information management systems should be purposefully designed with user interfaces for easy filtering of irrelevant information.
The latter point sounds straightforward, but, in actuality, requires a semantic underpinning to the enterprise’s information assets. This requirement is because relevancy is in the eye of the beholder, and different users have different terms, perspectives, and world views by which information evaluation occurs. In order for useful filtering, information must be presented in similar terms and perspectives relevant to those users. Since multiple studies affirm that information decision-makers seek more information beyond their overload points [3], it is thus more useful to provide relevant access and filtering methods that can be tailored by user rather than “top down” information restrictions.
Law #7: Information is Self-propagating
With access and connections, information tends to beget more information. This propagation results from summations, analysis, unique combinations and other ways that basic datum get recombined into new datum. Thus, while the first law noted that information can not be consumed (or depleted) by virtue of its use, we can also say that information tends to reproduce and expand itself via use and inspection.
Indeed, knowledge itself is the result of how information in its native state can be combined and re-organized to derive new insights. From a valuation standpoint, it is this very understanding that leads to such things as competitive intelligence or new know-how. In combination with insights from connections, this propagating factor of information is the other leading source of intangible asset valuations.
This law also points to the fact that information per se is not a scarce resource. (Though its availability may be scarce.) Once available, techniques like data mining, analysis, visualization and so forth can be rich sources for generating new information from existing holdings of data.
Information as an Asset and How to Value
These “laws” — or perspectives — help to frame the imperatives for how to judge information as an asset and its resulting value. The methodological and conceptual issues of how to explicitly account for information on a company’s books are, of course, matters best left to economists and professional accountants. With the growing share of information in relation to intangible assets, this would appear to be a matter of great importance to national policy. Accounting for R&D efforts as an asset versus a cost, for example, has been estimated to add on the order of 11 percent to US national GDP estimates [9].
The mere generation of information is not necessarily an asset, as the “laws” above indicate. Some of the information has no value and some indeed represents a net sunk cost. What we can say, however, is that valuable information that is created by the enterprise but remains unused or is duplicated means that what was potentially an asset has now been turned into a cost — sometimes a cost repeated many-fold.
Information that is used is an asset, intangible or not. Here, depending on the nature of the information and its use, it can be valued on the basis of cost (historical cost or what it cost to develop it), market value (what others will pay for it), or utility (what is its present value as benefits accrue into the future). Traditionally the historical cost method has been applied to information. Yet, since information can both be sold and still retained by the organization, it may have both market value and utility value, with its total value being the sum.
In looking at these factors, Moody and Walsh propose a number of new guidelines in keeping with the “laws” noted above [3]:
- Operational information should be measured as the cost of collection using data entry costs
- Management information should be valued based on what it cost to extract the data from operational systems
- Redundant data should be considered to have zero value (Law #1)
- Unused data should be considered to have zero value (Law #2)
- The number of users and number of accesses to the data should be used to multiply the value of the information (Law #2). When information is used for the first time, it should be valued at its cost of collection; subsequent uses should add to this value (perhaps on a depreciated basis; see below)
- The value of information should be depreciated based on its “shelf life” (Law #3)
- The value of information should be discounted by its accuracy relative to what is considered to be acceptable (Law #4)
- And, as an added factor, information that is effectively linked or combined should have its value multiplied (Law #5), though the actual multiplier may be uncertain [5].
The net result of thinking about information in this more purposeful way is to encourage more accurate valuation methods, and to provide incentives for more use and re-use, particularly in combined ways. Such methods can also help distinguish what information is of more value to the organization, and therefore worthy of more attention and investment.
The Growing Importance of Intangible Information
The emerging discrepancy between market capitalizations and book values began to get concerted academic attention in the 1990s. To be sure, perceptions by the market and of future earnings potential can always color these differences. The simple occurrence of a discrepancy is not itself proof of erroneous or inaccurate valuations. (And, the corollary is that the degree of the discrepancy is not sufficient alone to estimate the intangible asset “gap”, a logical error made by many proponents.) But, the fact that these discrepancies had been growing and appeared to be based (in part) on structural changes linked to intangibles was creating attention.
Leonard Nakamura, an economist with the Federal Reserve Board in Philadelphia, published a working paper in 2001 entitled, “What is the U.S. Gross investment in Intangibles? (At Least) One Trillion Dollars a Year!” [6]. This was one of the first attempts to measure intangible investments, which he defined as private expenditures on assets that are intangible and necessary to the creation and sale of new or improved products and processes, including designs, software, blueprints, ideas, artistic expressions, recipes, and the like. Nakamura acknowledged his work as being preliminary. But he did find direct and indirect empirical evidence to show that US private firms were investing at least $1 trillion annually (as of 2000, the basis year for the data) in intangible assets. Private expenditures, labor and corporate operating margins were the three measurement methods. The study also suggested that the capital stock of intangibles in the US has an equilibrium market value of at least $5 trillion.
Another key group — Carol Corrado, Charles Hulten, and Daniel Sichel, known as “CHS” across their many studies — also began to systematically evaluate the extent and basis for intangible assets and its discrepancy [7]. They estimated that spending on long-lasting knowledge capital — not just intangibles broadly — grew relative to other major components of aggregate demand during the 1990s. CHS was the first to show that by the turn of the millenium that fixed US investment in intangibles was at least as large as business investment in traditional, tangible capital.
By later in the decade, Nakamura was able to gather and analyze time series data that showed the steady increase in the contributions of intangibles [8]:
One can see the cross-over point late in the decade. Investment in intangibles he now estimates to be on the order of 8% to 10% of GDP annually in the US.
Roughly at the same time the National Academies in the US was commissioned to investigate the policy questions of intangible assets. The resulting major study [9] contains much relevant information. But it, too, contained an update by CHS on their slightly different approach to analyzing the growing role of intangible assets:
This CHS analysis shows similar trends to what Nakamura found, though the degree of intangible contributions is estimated as higher (~14% of annual GDP today), with investments in intangibles exceeding tangible assets somewhat earlier.
Surveys of more than 5,000 companies in 25 companies confirmed these trends from a different perspective, and also showed that most of these assets did not get reflected in financial statements. A large portion of this value was due to “brands” and other market intangibles [10]. The total “undisclosed” portion appeared to equal or exceed total
reported assets. Figures for the US indicated there might be a cumulative basis of intangible assets of $9.2 trillion [11].
In parallel, these groups and others began to decompose the intangible asset growth by country, sector, or asset type. The specific component of “information” received a great deal of attention. Uday Apte, Uday Karmarkar and Hiranya Nath, in particular, conducted a couple of important studies during this decade [12,13]. For example, they found nearly two-thirds of recent US GDP was due to information or knowledge industry contributions, a percentage that had been growing over time. They also found that a secondary sector of information internal to firms itself constituted well over 40% of the information economy, or some 28% of the entire economy. So the information activities internal to organizations and institutions represent a very large part of the economy.
The specific components that can constitute the informational portion of intangible assets has also been looked at by many investigators, importantly including key accounting groups. FASB, for example, has specific guidance on treatment of intangible assets in SFAS 141 [14]. Two-thirds of the 90 specific intangible items listed by the American Institute of Certified Public Accountants are directly related to information (as opposed to contracts, brands or goodwill), as shown in [15]. There has also been some good analysis by CHS on breakdowns by intangible assets categories [16]. There are also considerable differences by country on various aspects of these measures (for example, [10]). For example, according to OECD figures from 2002, expenditures for knowledge (R&D, education and software) ranged from nearly 7 percent (Sweden) to below 2 percent (Greece) in OECD countries, with the average of about 4 percent and the US at over 6 percent [17].
. . . Plus Too Much Information Goes Unused
The common view is that a typical organization only uses 5 to 7 percent of the information it already has on hand [18], and 20% to 25% of a knowledge worker’s time is spent simply trying to find information [19]. To probe these issues more deeply, I began a series of analyses in 2004 looking at how much money was being spent on preparing documents within US companies, and how much of that investment was being wasted or not re-used [20]. One key finding from that study was that the information within documents in the US represent about a third of total gross domestic product, or an amount equal at the time of the study to about $3.3 trillion annually (in 2010 figures, that would be closer to $4.7 trillion). This level of investment is consistent with the results of Apte et al. and others as noted above.
However, for various reasons — mostly due to lack of awareness and re-use — some 25% of those trillions of dollar spent annually on document creation costs are wasted. If we could just find the information and re-use it, massive benefits could accrue, as these breakdowns in key areas show:
| U.S. FIRMS |
$ Million |
% |
| Cost to Create Documents |
$3,261,091 |
|
|
|
|
| Benefits to Finding Missed or Overlooked Documents |
$489,164 |
63% |
| Benefits to Improved Document Access |
$81,360 |
10% |
| Benefits of Re-finding Web Documents |
$32,967 |
4% |
|
|
|
| Benefits of Proposal Preparation and Wins |
$6,798 |
1% |
| Benefits of Paperwork Requirements and Compliance |
$119,868 |
15% |
| Benefits of Reducing Unauthorized Disclosures |
$51,187 |
7% |
|
|
|
| Total Annual Benefits |
$781,314 |
100% |
|
|
|
| PER LARGE FIRM |
$ Million |
|
| Cost to Create Documents |
$955.6 |
|
|
|
|
| Benefits to Finding Missed or Overlooked Documents |
$143.3 |
|
| Benefits to Improving Document Access |
$23.8 |
|
| Benefits of Re-finding Web Documents |
$9.7 |
|
|
|
|
| Benefits of Proposal Preparation and Wins |
$2.0 |
|
| Benefits of Paperwork Requirements and Compliance |
$35.1 |
|
| Benefits of Reducing Unauthorized Disclosures |
$15.0 |
|
|
|
|
| Total Annual Benefits |
$229.0 |
|
Table. Mid-range Estimates for the Annual Value of Documents, U.S. Firms, 2002 [20]
The total benefit from improved document access and use to the U.S economy is on the order of 8% of GDP. For the 1,000 largest U.S. firms, benefits from these improvements can approach nearly $250 million annually per firm (2002 basis). About three-quarters of these benefits arise from not re-creating the intellectual capital already invested in prior document creation. About one-quarter of the benefits are due to reduced regulatory non-compliance or paperwork, or better competitiveness in obtaining solicited grants and contracts.
This overall value of document use and creation is quite in line with the analyses of intangible assets noted above, and which arose from totally different analytical bases and data. This triangulation brings confidence that true trends in the growing importance of information have been identified.
How Big is the Information Asset Gap?
These various estimates can now be combined to provide an assessment of just how large the “gap” is for the overlooked accounting and use of information assets:
|
GDP ($T) |
Intangible % |
Info Contrib % |
Info Assets ($T) |
Unused Info ($T) |
Total ($T) |
|
|
Lo |
Hi |
Lo |
Hi |
Lo |
Hi |
Lo |
Hi |
Lo |
Hi |
| US |
$14.72 |
9% |
14% |
33% |
67% |
$0.44 |
$1.38 |
$0.30 |
$1.21 |
$0.74 |
$2.60 |
| European Union |
$15.25 |
8% |
12% |
33% |
50% |
$0.40 |
$0.92 |
$0.31 |
$1.26 |
$0.72 |
$2.17 |
| Remaining Advanced |
$10.17 |
8% |
12% |
33% |
50% |
$0.27 |
$0.61 |
$0.21 |
$0.84 |
$0.48 |
$1.45 |
| Rest of World |
$34.32 |
2% |
6% |
10% |
25% |
$0.07 |
$0.51 |
$0.00 |
$0.71 |
$0.07 |
$1.22 |
|
|
|
|
|
|
|
|
|
|
|
|
| Total |
$74.46 |
|
|
|
|
$1.18 |
$3.42 |
$0.83 |
$4.02 |
$2.00 |
$7.44 |
| Notes (see endnotes) |
[21] |
[22] |
[23] |
|
|
|
|
|
Depending, these estimates can either be viewed as being too optimistic about the importance of information assets [25] or too conservative [26]. The breadth of the ranges of these values is itself an expression of the uncertainty in the numbers and the analysis.
The analysis shows that, globally, the value of unused and unaccounted information assets may be on the order of $2.0 trillion to $7.4 trillion annually, with a mid-range value of $4.7 trillion. Even considering uncertainties, these are huge, huge numbers by any account. For the US alone, this range is $750 billion to $2.6 trillion annually. The analysis from the prior studies [20] would strongly suggest the higher end of this range is more likely than the lower. Similarly large gaps likely occur within the European Union and within other advanced nations. For individual firms, depending on size, the benefits of understanding and closing these gaps can readily be measured in the millions to billions [27].
At the high end, these estimates suggest that perhaps as much as 10% of global expenditures is wasted and unaccounted for due to information-related activities. This is roughly equivalent to adding a half of the US economy to the global picture.
In the concluding section, we touch on why such huge holes may appear in the world’s financial books. Clearly, though, even with uncertain and heroic assumptions, the magnitude of this gap is huge, with compelling needs to understand and close it as soon as possible.
The Relationship to Semantic Technologies
The seven Moody and Walsh information “laws” provide the clues to the reasons why we are not properly accounting for information and why we inadequately use it:
- We don’t know what information we have and can not find it
- What we have we don’t connect
- We misallocate resources for generating, capturing and storing information, because we don’t understand its value and potential
- We don’t manage the use of information or its re-use
- We duplicate efforts
- We inadequately leverage what information we have and miss valuable (that is, can be “valuated”) insights that could be gained.
Fundamentally, because information is not understood in our bones as central to the well-being of our enterprises, we continue to view the generation, capture and maintenance of information as a “cost” and not an “asset”.
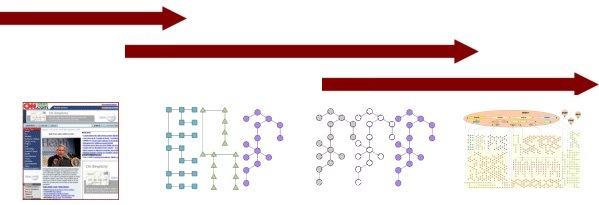
I have maintained for some time an interactive information timeline [28] that attempts to encompass the entire human history of information innovations. For tens of thousands of years steady — yet slow — progress in the ways to express and manage information can be seen in this timeline. But, then, beginning with electricity and then digitization, the pace of innovation explodes.
The same timeframe that sees the importance of intangible assets appear on national and firm accounts is when we see the full digitization of information and its ability to be communicated and linked over digital networks. A very insightful figure by Rama Hoetzlein for his thesis in 2007, which I have modified and enhanced, captures this evolution with some estimated dates as is shown below (click to expand) [29]:
The first insight this figure provides is that all forms of information are now available in digital form. This includes unstructured (images and documents), semi-structured (mark-up and “tagged” information) and structured (database and spreadsheet) information. This information can now be stored and communicated over digital networks with broadly accepted protocols.
But the most salient insight is that we now have the means through semantic technologies and approaches to interrelate all of this information together. Tagging and extraction methods enable us to generate metadata for unstructured documents and content. Data models based on predicate logic and semantic logics give us the flexible means to express the relationships and connections between information. And all of this can be stored and manipulated through graph-based datastores and languages such that we can draw inferences and gain insights. Plus, since all of this is now accessible via the Web and browsers, virtually any user can access, use and leverage this information.
This figure and its dates not only shows where we have come as a species in our use and sophistication with information, but how we need to bring it all together using semantics to complete our transition to a knowledge economy.
The very same metadata and semantic tagging capabilities that enable us to interrelate the information itself also provides the techniques by which we can monitor and track usage and provenance. It is through these additional semantic methods that we can finally begin to gain insight as to what information is of what value and to whom. Tapping this information will complete the circle for how we can also begin to properly valuate and then manage and optimize our information assets.
Conclusion
With our transition to an information economy, we now see that intangible assets exceed the value of tangible ones. We see that the information component of these intangibles represent one-third to two-thirds of these intangibles. In other words, information makes up from 17% to more than one-third of an individual firm’s value in modern economies. Further, we see that at least 25% of firm expenditures on information is wasted, keeping it as a cost and negating its value as an asset.
The “factories” of the modern information economy no longer produce pins with the fixed inputs of labor and capital as in the time of Adam Smith. They rather produce information and knowledge and know-how. Yet our management and accounting systems seem fixed in the techniques of yesteryear. The quaint idea of total factor productivity as a “residual” merely belies our ignorance about the causes of economic growth and firm value. These are issues that should rightly occupy the attention of practitioners in the disciplines of accounting and management.
Why industrial-era accounting methods have been maintained in the present information age is for students of corporate power politics to debate. It should suffice to remind us that when industrialization induced a shift from the extraction of funds from feudal land possessions to earning profits on invested capital, most of the assumptions about how to measure performance had to change. When the expenses for acquiring information capabilities cease to be an arbitrary budget allocation and become the means for gaining Knowledge Capital, much of what is presently accepted as management of information will have to shift from a largely technological view of efficiency to an asset management perspective [30].
Accounting methods grounded in the early 1800s that are premised on only capital assets as the means to increase the productivity of labor no longer work. Our engines of innovation are not physical devices, but ideas, innovation and knowledge; in short, information. Capable executives recognize these trends, but have yet to change management practices to address them [31].
As managers and executives of firms we need not await wholesale modernization of accounting practices to begin to make a difference. The first step is to understand the role, use and importance of information to our organizations. Looking clearly at the seven information “laws” and what that means about tracking and monitoring is an immediate way to take this step. The second step is to understand and evaluate seriously the prospects for semantic approaches to make a difference today.
We have now sufficiently climbed the data federation pyramid [32] to where all of our information assets are digital; we have network protocols to link it; we have natural language and extraction techniques for making documents first-class citizens along side structured data; and we have logical data models and sound semantic technologies for tying it all together.
We need to reorganize our “factory” floors around these principles, just as prime movers and unit electric drives altered our factories of the past. We need to reorganize and re-think our work processes and what we measure and value to compete in the 21st century. It is time to treat information as seriously as it has become an integral part of our enterprises. Semantic technologies and approaches provide just the path to do so.
[1] Baruch Lev and Jürgen H. Daum, 2003. “Intangible Assets and the Need for a Holistic and More Future-oriented Approach to Enterprise Management and Corporate Reporting,” prepared for the 2003 PMA Intellectual Capital Symposium, 2nd October 2003, Cranfield Management Development Centre, Cranfield University, UK; see
http://www.juergendaum.de/articles/pma_ic_symp_jdaum_final.pdf.
[2] Claude E. Shannon and Warren Weaver, 1949.
The Mathematical Theory of Communication. The University of Illinois Press, Urbana, Illinois, 1949. ISBN 0-252-72548-4.
[3] Daniel Moody and Peter Walsh, 1999. “Measuring The Value Of Information: An Asset Valuation Approach,” paper presented at the
Seventh European Conference on Information Systems (ECIS’99), Copenhagen Business School, Frederiksberg, Denmark, 23-25 June, 1999. See
http://wwwinfo.deis.unical.it/zumpano/2004-2005/PSI/lezione2/ValueOfInformation.pdf. A precursor paper that is also quite helpful and cited much in Moody and Walsh is R. Glazer, 199. “Measuring the Value of Information: The Information Intensive Organisation”,
IBM Systems Journal, Vol 32, No 1, 1993.
[4] Some trade secrets could buck this trend if the value of the underlying enterprise that relies on them increases.
[6] Leonard Nakamura, 2001.
What is the U.S. Gross Investment in Intangibles? (At Least) One Trillion Dollars a Year!,
Working Paper No. 01-15, Federal Reserve Bank of Philadelphia, October 2001; see
http://www.phil.frb.org/files/wps/2001/wp01-15.pdf.
[9]
Christopher Mackie, Rapporteur, 2009. Intangible Assets: Measuring and Enhancing Their Contribution to Corporate Value and Economic Growth: Summary of a Workshop, prepared by
the Board on Science, Technology, and Economic Policy (STEP) Committee on National Statistics (CNSTAT), ISBN: 0-309-14415-9, 124 pages; see http://www.nap.edu/openbook.php?record_id=1274 (available for PDF download with sign-in).[10] Brand Finance, 2006.
Global Intangible Tracker 2006: An Annual Review of the World’s Intangible Value, paper published by Brand Finance and The Institute of Practitioners in Advertising, London, UK, December 2006. See
http://www.brandfinance.com/images/upload/9.pdf.
[13] Uday M. Apte, Uday S. Karmarkar and Hiranya K Nath, 2008. “Information Services in the US Economy: Value, Jobs and Management Implications,”
California Management Review, Vol. 50, No.3, 12-30, 2008.
[15] See further, AICPA Special Committee on Financial Reporting, 1994. Improving Business Reporting—A Customer Focus: Meeting the Information Needs of Investors and Creditors. See http://www.aicpa.org/InterestAreas/AccountingAndAuditing/Resources/EBR/DownloadableDocuments/Jenkins%20Committee%20Report.pdf.
| Blueprints Book librariesBroadcast licenses
Buy-sell agreements
Certificates of need
Chemical formulas
Computer software
Computerized databases
Contracts
Cooperative agreements
Copyrights
Credit information files
Customer contracts
Customer and client lists
Customer relationships |
Designs and drawings Development rightsEmployment contracts
Engineering drawings
Environmental rights
Film libraries
Food flavorings and recipes
Franchise agreements
Historical documents
Heath maintenance organization enrollment lists
Know-how
Laboratory notebooks
Literary works
Management contracts
Manual databases |
Manuscripts Medical charts and recordsMusical compositions
Newspaper morgue files
Noncompete covenants
Patent applications
Patents (both product and process)
Patterns
Prescription drug files
Prizes and awards
Procedural manuals
Product designs
Proposals outstanding
Proprietary computer software
Proprietary processes |
Proprietary products Proprietary technologyPublications
Royalty agreements
Schematics and diagrams
Shareholder agreements
Solicitation rights
Subscription lists
Supplier contracts
Technical and specialty libraries
Technical documentation
Technology-sharing agreements
Trade secrets
Trained and assembled workforce
Training manuals |
[18] The 5% estimate comes from Graham G. Rong, Chair at MIT Sloan CIO Symposium, as reported in the
SemanticWeb.com on May 5, 2011. (Rong also touted the use of semantic technologies to overcome this lack of use.) A similar 7% estimate comes from Pushpak Sarkar, 2002. “Information Quality in the Knowledge-Driven Enterprise,”
InfoManagement Direct, November 2002. See
http://www.information-management.com/infodirect/20021115/6045-1.html.
[21] From the CIA, 2011.
The World Factbook; accessed online at
https://www.cia.gov/library/publications/the-world-factbook/index.html on May 9, 2011. The “remaining advanced” countries are Australia, Canada, Iceland, Israel, Japan, Liechtenstein, Monaco, New Zealand, Norway, Puerto Rico, Singapore. South Korea, Switzerland, Taiwan.
[22] The range of estimates is drawn from the Nakamura
[8] and CHS
[9] studies, with each respectively providing the lower and upper bounds. These values have been slightly decremented for non-US advanced countries, and greatly reduced for non-advanced ones.
[23] The high range is based on the categorical share of intangible asset categories (60 of 90) from the AIPCA work
[15]; the lower range is from the one-third of GDP estimates from
[20].These values have been slightly decremented for non-US advanced countries, and greatly reduced for non-advanced ones.
[24] For unused information assets, the high range is based on the one-third of GDP and 25% “waste” estimates from
[20]; the low range halves each of those figures. These values have been slightly decremented for non-US advanced countries, and greatly reduced for non-advanced ones (and zero for the low range).
[25] Reasons for the estimates to be too optimistic are information as important as goodwill; branding; intellectual basis of cited resources is indeed real; considerable differences by country and sector (see
[10] and
[16]).
[26] Reasons for the estimates to be too conservative: no network effects; greatly discounted non-advanced countries; share is growing (but older estimates used); considerable differences by country and sector (see
[10] and
[16]).
[27] For some discussion of individual firm impacts and use cases see
[10] and
[20], among others.
[29] This figure is a modification of the original published by Rama C. Hoetzlein, 2007.
Quanta – The Organization of Human Knowedge: Systems for Interdisciplinary Research, Master’s Thesis, University of California Santa Barbara, June 2007; see
http://www.rchoetzlein.com/quanta/ (p 112). I adapted this figure to add logics, data and metadata to the basic approach, with color coding also added.
[31] For example, according to
[11], in a 2003 Accenture survey of senior managers across industries, 49 percent of respondents said that intangible assets are their primary focus for delivering long-term shareholder value, but only 5 percent stated that they had an organized system to track the performance of these assets. Also, according sources cited in Gio Wiederhold, Shirley Tessler, Amar Gupta and David Branson Smith, 2009. “The Valuation of Technology-Based Intellectual Property in Offshoring Decisions,” in
Communications for the Association of Information Systems (CAIS) 24, May 2009 (see
http://ilpubs.stanford.edu:8090/951/2/Article_07-270.pdf): Owners and stockholders acknowledge that IP valuation of technological assets is not routine within many organizations. A 2007 study performed by Micro Focus and INSEAD highlights the current state of affairs: Of the 250 chief information officers (CIOs) and chief finance officers (CFOs) surveyed from companies in the U.S., UK, France, Germany, and Italy, less than 50 percent had attempted to value their IT assets, and more than 60 percent did not assess the value of their software.


 A Decade of Remarkable Advances in Ten Grand IT Challenges
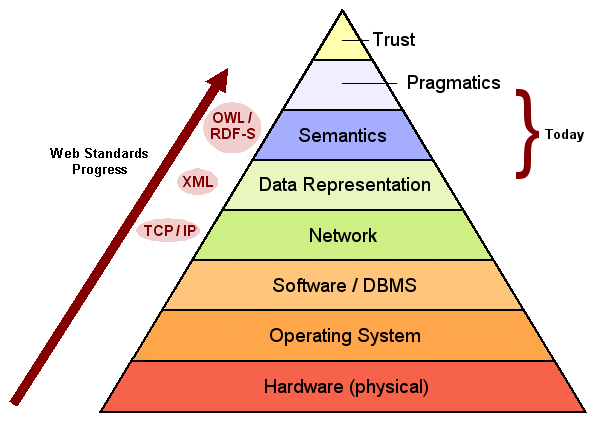


