AI3 Assembles 26 Candidate Tools
The pending UMBEL subject concept “backbone” ontology will involve literally thousands of concepts. In order to manage and view such a large structure, a concerted effort to find suitable graph visualization software was mounted. This post presents the candidate listing, as well as some useful starting resources and background information.
A subsequent post will present the surprise winner of our evaluation.
Starting Resources
- See http://www.visualcomplexity.com/vc/. Viewing the various graphs under Knowledge Networks shows some exemplars, that also often leads to a citation of the software used to create the graph
- Information Aesthetics has nice daily charts and an OK search facility
- The InfoVis:Wiki provides a community platform and forum integrating recent developments and news on all areas and aspects of Information Visualization
- See also “Network Visualization by Semantic Substrates” with examples and tools (PDF)
- NetworkViz is a project hosted by Sourceforge that has been intended to be a melting pot for all open source projects related to graph visualisation
- There is an interesting essay on text visualization and many graphics examples
- WikiViz is a nice wiki for information visualization and tools
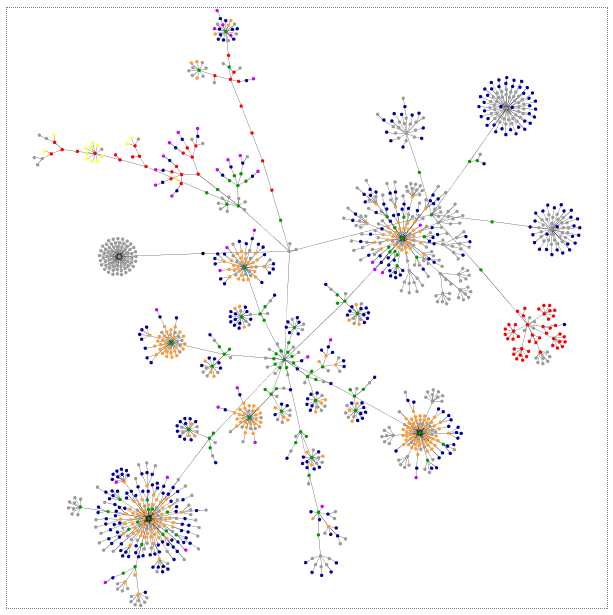
- A great example of “elastomeric” or spring graphs, at which you can model any arbitrary Web site, is http://www.aharef.info/static/htmlgraph/. (The basic graphic program behind this is http://www.cs.princeton.edu/~traer/physics/ and the Processing software.) The example below is for this AI3 blog (also compare to my first posting nearly two years ago on this neat tool):
Various Example Visualizations
For grins, you may also like to see various example visualizations, most with a large-graph bent:
- clusterball wikipedia categories
- Chris Harrison’s similar WikiViz
- visuwords graphical dictionary open source using WordNet; online and downloadable
- mnemomap search mapping
- WebBrain hierarchical search visualization; not too different
- semaspace semantic network
- javascript visual wordnet
- regular expression visualizer.
Software Options
Here is the listing of 26 candidate graph visualization programs assembled to date:
- Cytoscape – this tool, based on GINY and Piccolo (see below), is under active use by the bioinformatics community and highly recommended by Bio2RDF.org
- GINY implements a very innovative system for sub-graphing and allows for stunning visuals. GINY is open source, provides a number of layout algorithms, and is designed to be a very intuitive API. Uses Piccolo
- graphviz – graphviz is a set of graph drawing tools and libraries. It supports hierarchical and mass-spring drawings; although the tools are scalable, their emphasis is on making very good drawings of reasonably-sized graphs. Package components include batch layout filters and interactive editors
- HyperGraph is an open source project that provides Java code to work with hyperbolic geometry and especially with hyperbolic trees. It provides a very extensible API to visualize hyperbolic geometry, to handle graphs and to layout hyperbolic trees
- Hypertree is an open source project very similar to the HyperGraph project. As the name implies, Hypertree is restricted to hyperbolic trees
- The InfoVis Toolkit – is an interactive graphics toolkit written in Java to ease the development of Information Visualization applications and components
- IsaViz – IsaViz is a visual environment for browsing and authoring Resource Description Framework (RDF) models represented as graphs
- JGraph – according to its developers, this is the most powerful, easy-to-use, feature-rich and standards-compliant open source graph component available for Java. Many implementation options shown on this screenshots page, including possibly JGraphT
- JUNG — the Java Universal Network/Graph Framework is a software library that provides a common and extendible language for the modeling, analysis, and visualization of data that can be represented as a graph or network. It is written in Java, which allows JUNG-based applications to make use of the extensive built-in capabilities of the Java API, as well as those of other existing third-party Java libraries. RDF Gravity uses JUNG
- LGL – LGL (Large Graph Library) is a compendium of applications for making the visualization of large networks and trees tractable. LGL was specifically motivated by the need to make the visualization and exploration of large biological networks more accessible
- LibSea – LibSea is both a file format and a Java library for representing large directed graphs on disk and in memory. Scalability to graphs with as many as one million nodes has been the primary goal. Additional goals have been expressiveness, compactness, and support for application-specific conventions and policies
- Mondrian – is a general purpose statistical data-visualization system written in Java. It features outstanding visualization techniques for categorical data, geographical data and large datasets
- OpenDX – OpenDX is a uniquely powerful, full-featured software package for the visualization of scientific, engineering and analytical data. OpenDX is the open source software version of IBM’s Visualization Data Explorer Product. The last release of Data Explorer from IBM was 3.1.4B; the open source version is based on this version
- Otter – Otter is a historical CAIDA tool used for visualizing arbitrary network data that can be expressed as a set of nodes, links or paths. Otter was developed to handle visualization tasks for a wide variety of Internet data, including data sets on topology, workload, performance, and routing. Otter is in maintenance rather than development mode
- Pajek – Pajek (Slovene word for Spider) is a program, for Windows, for analysis and visualization of large networks. It is freely available for noncommercial use, and has been called by others the “best available”. See also the PDF reference manual for Pajek
- Piccolo – is a toolkit that supports the development of 2D structured graphics programs, in general, and Zoomable User Interfaces (ZUIs), in particular. It is used to develop full-featured graphical applications in Java and C#, with visual effects such as zooming, animation and multiple representations
- Prefuse – Prefuse is a user interface toolkit for building highly interactive visualizations of structured and unstructured data. This includes any form of data that can be represented as a set of entities (or nodes) possibly connected by any number of relations (or edges). Examples of data supported by prefuse include hierarchies (organization charts, taxonomies, file systems), networks (computer networks, social networks, web site linkage) and even non-connected collections of data (timelines, scatterplots). See also Jeff Heer, the author of Prefuse (http://jheer.org/)
- RDF Gravity – RDF Gravity is a tool for visualising RDF/OWL Graphs/ ontologies. It is implemented by using the JUNG Graph API and Jena semantic web toolkit
- SemaSpace – is a fast and easy to use graph editor for large knowledge networks
- TouchGraph is a set of interfaces for Graph Visualization using spring-layout and focus+context techniques. Current applications include a utility for organizing links, a visual Wiki Browser, and a Google Graph Browser which uses the Google API; see also the commercial site at http://www.touchgraph.com/
- TreeMap is a tool for treemap visualisation
- Tulip – Tulip is a software system dedicated to the visualization of huge graphs. It manages graphs with up to 1 M elements (node and edges) on a personal computer. Its SuperGraph technology architecture provides the following features: 3D visualizations, 3D modifications, plugin support, support for clusters and navigation, automatic graph drawing, automatic clustering of graphs, automatic selection of elements, and automatic coloring of elements according to a metric
- Visual Browser is a Java application that can visualise the data in RDF schemes
- Walrus – Walrus is a tool for interactively visualizing large directed graphs in three-dimensional space. By employing a fisheye-like distortion, it provides a display that simultaneously shows local detail and the global context. It is technically possible to display graphs containing a million nodes or more, but visual clutter, occlusion, and other factors can diminish the effectiveness of Walrus as the number of nodes, or the degree of their connectivity, increases. Thus, in practice, Walrus is best suited to visualizing moderately sized graphs that are nearly trees. A graph with a few hundred thousand nodes and only a slightly greater number of links is likely to best target size
- xSiteable is a complete small-to-medium-size site development kit created in XSLT, with a PHP administration package.
IVC Software Framework – the InfoVis Cyberinfrastructure (IVC) software framework is a set of libraries that provide a simple and uniform programming-interface to algorithms and user-interface to end-users by leveraging the power of the Eclipse Rich Client Platform (RCP)


Gruff: A Grapher-Based Triple-Store Browser
http://www.franz.com/agraph/gruff
Use Gruff to display visual graphs of subsets of a store’s resources and their links. By selecting particular resources and predicates, you can build a visual graph that displays a variety of the relationships in a triple-store. Gruff can also display tables of all properties of selected resources or generate tables with SPARQL queries, and resources in the tables can be added to the visual graph
TreeBolic is another. http://treebolic.sourceforge.net/en/index.html
Quote from their web site:
Treebolic is a Java component (widget) whose purpose is to provide a hyperbolic rendering of hierarchical data.
A tree is rendered with nodes and edges but display space is subject to a particular curvature (hence the name) : more space is allocated to the focus node while the parent and children, still in the immediate visual context, appear slightly smaller. The grandparents and grandchildren are still visible but come out even smaller. As we move away from the focus node, less display space is allotted to the nodes, which gradually disappear towards the disk’s border, as though the whole hierarchy were seen through a fisheye lens.
Wrapped as a Java applet, the Treebolic widget can be embedded in a web page. Nodes may then contain hypertext links and the browser to other web pages.
The tree is dynamic (animation brings the focus node to the center) and responds to user interaction.
My suggestion is to take a look at GraphInsight. It’s written in C++/Qt for Windows,Mac ad Unix and has a very fast GUI interface, with 3D visualization in OpenGL. Its layout algorithm are very fast and is scalable up to milion nodes and edges. It supports Pajek .net files as well as dimacs and dot.
wwww.graphinsight.com
There’s also an open source tool called ICONVIS, from Polytechnic University of Turin: http://iconvis.polito.it
You might also add Linkurious. It’s a solution to search, explore and visualize graphs. I’m a co-founder of this project.
There’s also http://vowl.visualdataweb.org/webvowl/index.html
Howdy, Mike – This is Sam Smith writing from our new cottage in northern Michigan, overlooking beautiful Torch Lake. That is, when it is not cloudy and rainy, which it is today.
I stumbled onto this link trying to find a way to better visualize and be able to programmatically massage OWL files (problem: I’m mainly C# and visual studio oriented). Anyway, this post is another example of the marvelous work you have done in the area of Semantic Web technology. Thanks for the great survey of solutions. I hope I can find the link to your winner.
Best regards, Sam
Thank you for these list of tools. Do you of these tool can visualise the concepts, concept relation, and concept data properties of an ontology?