


Five Easy Steps to Embed Exhibit in a Blog
My earlier post gushed about the new Exhibit lightweight, structured data publishing system for Web pages from MIT’s Simile project. Because I was so impressed with the project’s examples, I decided to convert my existing 350+ semantic Web tools listing, Sweet Tools, to an online database. I also wanted to maintain the Google spreadsheet listing for others to make new tools suggestions.
Please see the NEW and IMPROVED Sweet Tools here, and now in database format! (And now updated to 378 tools!)
The remainder of this posting describes how I did this, following the online Exhibit tutorials. To my knowledge, this is the first time that an “exhibit” has been embedded within a blog system (WordPress in my example).
Five Easy Steps
- Though one can start with a standalone spreadsheet or other simple data structure, I began with a Google online spreadsheet (of the 350+ tools). I only needed to make a few changes in terms of {bracket identifiers} as column heads and to make explicit some other data features (such as ‘new’) that I had been handling before as formatting (see tutorials below). (I should mention that Exhibit seems to handle OK datasets as large as the one used here.) If you have a Google account, you can see the original, older version of the spreadsheet (which will no longer be updated or maintained) with its slightly modified new Google sibling
- I then followed the excellent “Getting Started” Exhibit tutorial, making all modifications locally. I worked with this local system until I got the display and presentation working the way I wanted it to with the various styles (I also decided to add thumbnails at this point; see thumbshots.org for examples and code)
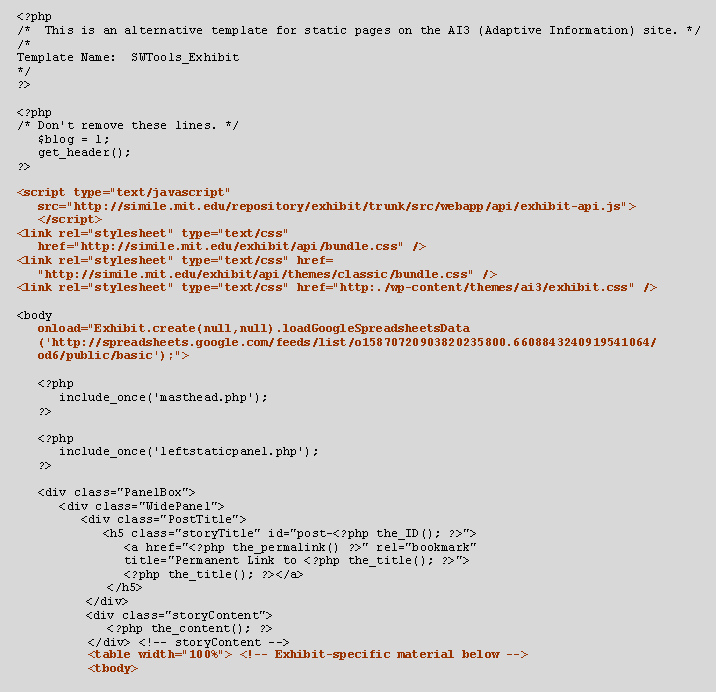
- Within WordPress I created a new page template, in which I embedded the Javascript, the body onLoad call, and the embedded table as described above in Step 2. IMPORTANT: You need to have system administration access to WordPress to make these modifications; hosted services might be difficult. IMPORTANT: Though not indicated in any of the tutorials, I also had to embed references to the Exhibit style sheets in the page template, since my existing blog styles were apparently not allowing the inheritance of the remote Exhibit styles. (I also chose to embed my local styles via link reference as well.) Please copy these references carefully! Thus, the top of my page template (with differences shown in bolded maroon) became:
- Then, via the Write Page function within the WordPress admin center, I created a new page post referencing this new page template. I embedded some lead-in paragraphs in the page itself (but that is not necessary), and
- Finally, I updated my local spreadsheet (and will continue to do so periodically), uploaded it to Google, and made sure that I removed any extraneous rows and columns from the data to be displayed. Then, I manually re-published the site, and published it, again according to the excellent Exhibit tutorial on working with Google spreadsheets, and viola!
General Observations
The remote data feed from Google spreadsheets is a very nice feature that also removes one further step from the standard (though simple!) Exhibit set-up.
You can used mixed case in your attribute descriptors (but no spaces!) for better label displays (such as capitalization). However, for some reason (I suspect it’s an early bug) you can not use mixed case on the first Google field, which also defaults to “label”.
The remote Exhibit styles should probably be called out separately and better commented. I’m still seeing some squirrelly styles behavior. (For example, the right-margin browse and filter selection box has some overlapping characters.) Though I can inspect the styles with tools like Web Developer, it is tricky to make local changes.
Like Tim Isenheim’s Timeline plug-in for WordPress, it probably makes sense for someone with PHP experience (not me!) to make an Exhibit plug-in as well.
Lastly, the existing Exhibit tutorials are very helpful, but more would also help. (Hint, hint David!) More examples of filtering, lenses, and layout templates would be especially helpful.
However, the most important observation is that Exhibit is a much more useful and flexible presentation format than simple spreadsheets. Though as a first-time experience it took me some trial-and-error to work out the details, it is really very easy and straightforward to add such capabilities to a WordPress blog.

Please note that the Safari and Opera problems mentioned were the fault of my specific WordPress configuration, and not a problem with Exhibit.
Please correct the instructions above now place any external JS and CSS calls in header.php, and not part of the specific Exhibit page template.
Mike