Breakthroughs in the Basis, Nature and Organization of Information Across Human History
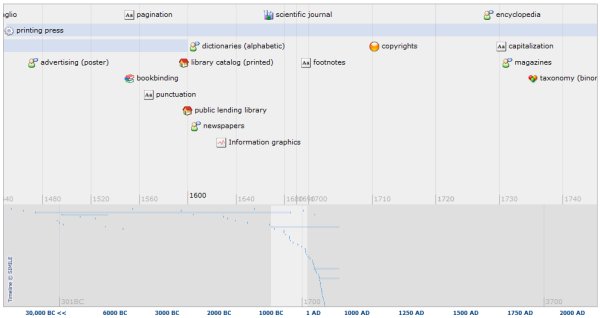
I’m pleased to present a timeline of 100 or so of the most significant events and developments in the innovation and management of information and documents from cave paintings ( ca 30,000 BC) to the present. Click on the link to the left or on the screen capture below to go to the actual interactive timeline.
This timeline has fast and slow scroll bands — including bubble popups with more information and pictures for each of the entries offered. (See the bottom of this posting for other usage tips.)
Note the timeline only presents non-electronic innovations and developments from alphabets to writing to printing and information organization and conventions. Because there are so many innovations and they are concentrated in the last 100 years or fewer, digital and electronic communications are somewhat arbitrarily excluded from the listing.
I present below some brief comments on why I created this timeline, some caveats about its contents, and some basic use tips. I conclude with thanks to the kind contributors.
Why This Timeline?
Readers of this AI3 blog or my detailed bio know that information — biological embodied in genes, or cultural embodied in human artefacts — has been my lifelong passion. I enjoy making connections between the biological and cultural with respect to human adaptivity and future prospects and I like to dabble on occasion as an amateur economic or information science historian. 
About 18 months ago I came across David Huynh‘s nifty Exhibit lightweight data display widget, gave it a glowing review, and then proceeded to convert my growing Sweet Tools listing of semantic Web and related tools to that format. Exhibit still powers the listing (which I just updated yesterday for the twelfth time or so).
At the time of first rolling out Exhibit I also noted that David had earlier created another lightweight timeline display widget that looked similarly cool (and which was also the first API for rendering interactive timelines in Web pages). (In fact, Exhibit and Timeline are but two of the growing roster of excellent lightweight tools from David.) Once I completed adopting Exhibit, I decided to find an appropriate set of chronological or time-series data to play next with Timeline.
I had earlier been ruminating on one of the great intellectual mysteries of human development: Why, roughly beginning in 1820 to 1850 or so, did the historical economic growth patterns of all prior history suddenly take off? I first wrote on this about two years ago in The Biggest Disruption in History: Massively Accelerated Growth Since the Industrial Revolution, with a couple of follow-ups and expansions since then.
I realized that in developing my thesis that wood pulp paper and mechanized printing were the key drivers for this major inflection change in growth (as they effected literacy and the broadscale access to written information) I already had the beginnings of a listing of various information innovations throughout history. So, a bit more than a year ago, I began adding to that list in terms of how humans learned to write, print, share, organize, collate, reproduce and distribute information and when those innovations occurred.
There are now about 100 items in this listing (I’m still looking for and researching others; please send suggestions at any time. 😉 ). Here are some of the current items in chronological order from upper left to lower right:
| cave paintings | codex | footnotes | microforms |
| ideographs | woodblock printing | copyrights | thesaurus |
| calendars | tree diagram | encyclopedia | pencil (mass produced) |
| cuneiform | quill pen | capitalization | rotary perfection press |
| papyrus (paper) | library catalog | magazines | catalogues |
| hieroglyphs | movable type | taxonomy (binomial classification) | typewriter |
| ink | almanacs | statistics | periodic table |
| alphabet | paper (rag) | timeline | chemical pulp (sulfite) |
| Phaistos Disc | word spaces | data graphs | classification (Dewey) |
| logographs | registers | card catalogs | linotype |
| maps | intaglio | lithography | mimeograph machine |
| scrolls | printing press | punch cards | kraft process (pulp) |
| manuscripts | advertising (poster) | steam-powered (mechanized) papermaking | flexography |
| glossaries | bookbinding | book (machine-paper) | classification (LoC) |
| dictionaries | pagination | chemcial symbols | classification (UDC) |
| parchment (paper) | punctuation | mechanical pencil | offset press |
| bibliographies | library catalog (printed) | chromolithography | screenprinting |
| concept of categories | public lending library | paper (wood pulp) | ballpoint pen |
| library | dictionaries (alphabetic) | rotary press | xerographic copier |
| classification system (library) | newspapers | mail-order catalog | hyperlink |
| zero | Information graphics | fountain pen | metadata (MARC) |
| paper | scientific journal |
So, off and on, I have been working with and updating the data and display of this timeline in draft. (I may someday also post my notes about how to effectively work with the Timeline widget.)
With the listing above, completion was sufficient to finally post this version. One of the neat things with Timeline is the ability to drive the display from a simple XML listing. I will update the timeline when I next have an opportunity to fill in some of the missing items still remaining on my innovations list such as alphabeticization, citations, and table of contents, among many others.
Some Interpretation Caveats
Of course, rarely can an innovation be traced to a single individual or a single moment in time. Historians are increasingly documenting the cultural milieu and multiple individuals that affect innovation.
In these regards, then, a timeline such as this one is simplistic and prone to much error and uncertainty. We have no real knowledge, for examples, for the precise time certain historical innovations occurred, and others (the ballpoint pen being one case in point) are a matter of interpretation as to what and when constituted the first expression. For instances where the record indicated multiple dates, I chose to use the date when released to the publlic.
Nonetheless, given the time scales here of more than 30,000 years, I do think broad trends and rough time frames can be discerned. As long as one interprets this timeline as indicative and not meant as definitive in any scholary sense, I believe this timeline can inform and provide some insight and guidance for how information has evolved over human history.
Some Use Tips
The operation of Timeline is pretty straightforward and intuitive. Here are a couple of tips to get a bit more out of playing with it:
- The timeline has two scrolling panels, fast and slow. For rapid scolling, use mouse down and left or right movement on the lower panel
- The lower panel also shows small ticks for each innovation in the upper panel
- Clicking any icon or label in the upper panel will cause a bubble popup to appear with a bit more detail and a picture for the item; click the ‘X’ to close the bubble
- Each entry is placed in one or more categories keyed by icon. You may “filter” results by using keywords such as: alphabets, book, calendars, libraries, maps, mechanization, paper, papermaking, printing, organizing, scripts, standardization, statistics, timelines, or typography. Partial strings also match
- Similarly, you may enter one of those same terms into one of the four color highlight boxes. Partial strings also match.
Sources, Contributions and Thanks
For the sake of consistency, nearly all entries and pictures on the timeline are drawn from the respective entries within Wikipedia. Subsequent updates may add to this listing by reference to original sources, at which time all sources will be documented.
The timeline icons are from David Vignoni’s Nuvola set, available under the LGPL license. Thanks David!
The fantastic Timeline was developed by David Huynh while he was a graduate student at MIT. Timeline and its sibling widgets were developed under funding from MIT’s Simile program. Thanks to all in the program and best wishes for continued funding and innovation.
Finally, my sincere thanks go to Professor Michael Buckland of the School of Information at the University of California, Berkeley, for his kind suggestions, input and provision of additonal references and sources. Of course, any errors or omissions are mine alone. I also thank Professor Buckland for his admonitions about use and interpretation of the timeline dates.


