


![]()
Where Has the Biology Community Been Hiding this Gem?
 I still never cease to be amazed at how wonderful and powerful tools are so often and easily overlooked. The most recent example is Cytoscape, a winner in our recent review of more than 25 tools for large-scale RDF graph visualization.
We began this review because the UMBEL subject concept “backbone” ontology will involve literally thousands of concepts. Graph visualization software suitable to very large graphs would aid UMBEL’s construction and refinement.
Cytoscape describes itself as a bioinformatics software platform for visualizing molecular interaction networks and integrating these interactions with gene expression profiles and other state data. Cytoscape is partially based on GINY and Piccolo, among other open-source toolkits. What is more important to our immediate purposes, however, is that its design also lends itself well to general network and graph manipulation.
Cytoscape was first brought to our attention by François Belleau of Bio2RDF.org. Thanks François, and also for the strong recommendation and tips. Special thanks are also due to Frédérick Giasson of Zitgist for his early testing and case examples. Thanks, Fred!
Requirements
We had a number of requirements and items on our wish list prior to beginning our review. We certainly did not expect most or all of these items to be met:
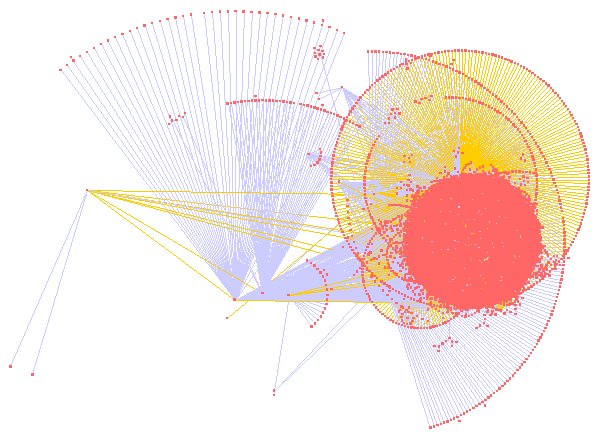
- Large scale – the UMBEL graph will likely have about 20,000 nodes or so; we would also like to be able to scale to instance graphs of hundreds of thousands or millions of nodes. For example, here is one representation of the full UMBEL graph (with nodes in pink-orange and different colored lines representing different relationships or predicates):
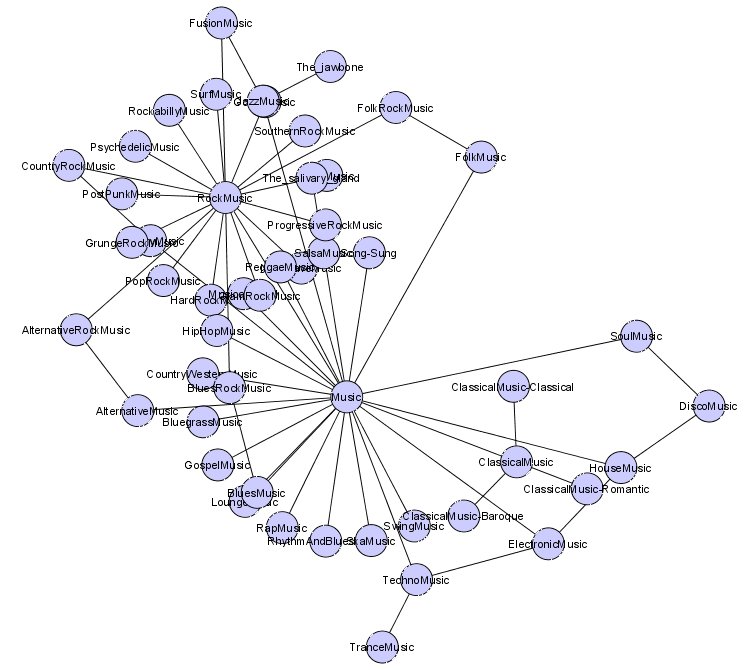
- Graph filtering – the ability to filter out the graph display by attribute, topology, selected nodes or other criteria. Again, here is an example using the ‘Organic’ layout produced by selecting on the Music node in UMBEL (click for full size):
- Graph analysis – the ability to analyze edge (or relation) lengths, cyclic aspects, missing nodes, imbalances across the full graph, etc.
- Extensibility – the ability to add new modules or plugins to the system
- Support for RDF – the ease for direct incorporation of RDF graphs
- Graph editing – the interactive ability to add, edit or modify nodes and relations, to select colors and display options, to move nodes to different locations, cut-and-past operations and other standard edits, and
- Graph visualization – the ease of creating sub-graphs and to plot the graphs with a variety of layout options.
Cytoscape met or exceeded our wish list in all areas save one: it does not support direct ingest of RDF (other than some pre-set BioPAX formats). However, that proved to be no obstacle because of the clean input format support of the tool. Simple parsing of triples into a CSV file is sufficient for input. Moreover, as described below, there are other cool attribute management functions that this clean file format supports as well.
Features and Attractions
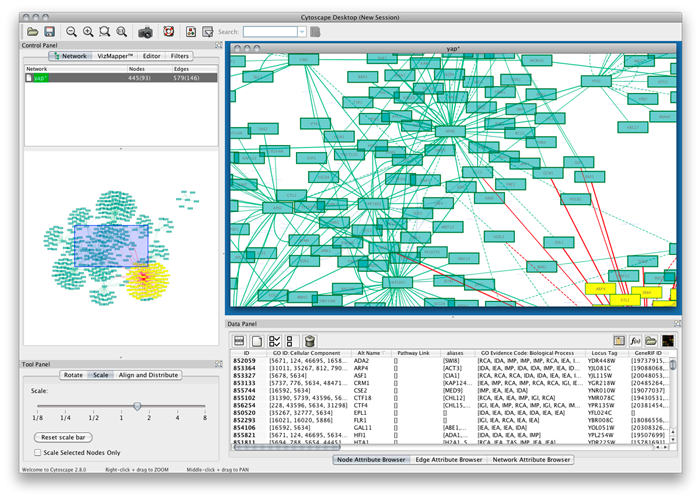
The following screen shot shows the major Cytoscape screen. We will briefly walk through some of its key views (click for full size):
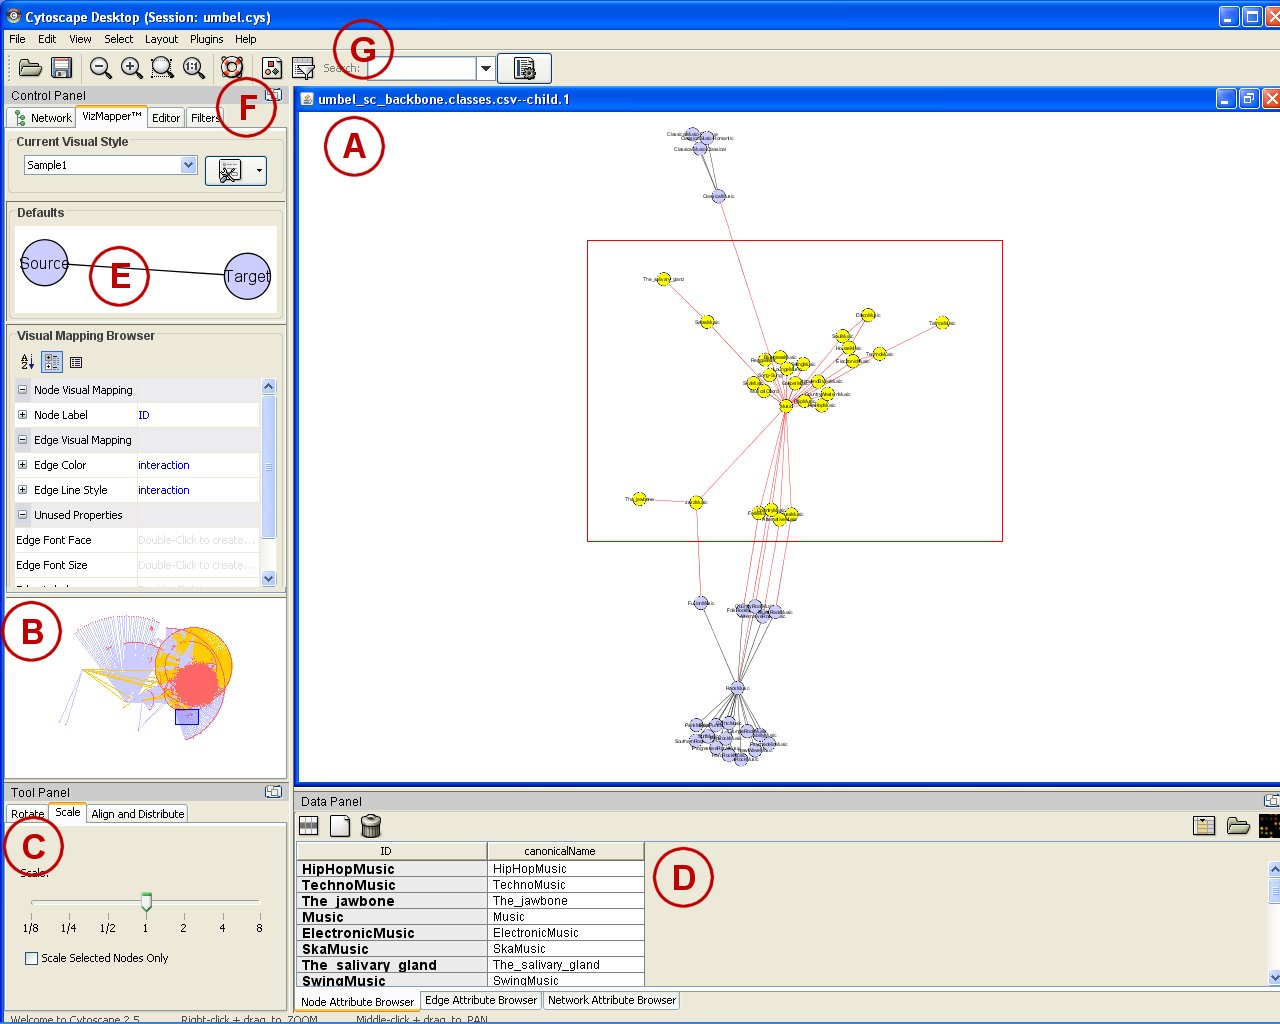
This Java tool has a fairly standard Eclipse-like interface and design. The main display window (A) shows the active portion of the current graph view. (Note that in this instance we are looking at a ‘Spring’ layout for the same Music sub-graph presented above.) Selections can easily be made in this main display (the red box) or by directly clicking on a node. The display itself represents a zoom (B) of the main UMBEL graph, which can also be easily panned (the blue box on B) or itself scaled (C). Those items that are selected in the main display window also appear as editable nodes or edges and attributes in the data editing view (D).
The appearance of the graph is fully editable via the VizMapper (E). An interesting aspect here is that every relation type in the graph (its RDF properties, or predicates) can be visually displayed in a different manner. The graphs or sub-graphs themselves can be selected, but also most importantly, the display can respond to a very robust and flexible filtering framework (F). Filters can be easily imported and can apply to nodes, edges (relations), the full graph or other aspects (depending on plugin). A really neat feature is the ability to search the graph in various flexible ways (G), which alters the display view. Any field or attribute can be indexed for faster performance.
In addition to these points, Cytoscape supports the following features:
- Load and save previously-constructed interaction networks in GML format (Graph Markup Language)
- Load and save networks and node/edge attributes in an XML document format called XGMML (eXtensible Graph Markup and Modeling Language)
- Load and save arbitrary attributes on nodes and edges. For example, input a set of custom annotation terms or confidence values
- Load and save state of the Cytoscape session in a Cytoscape Session (.cys) file. Cytoscape Session file includes networks, attributes (for node/edge/network), desktop states (selected/hidden nodes and edges, window sizes), properties, and visual styles (which are namable)
- Customize network data display using powerful visual styles
- Map node color, label, border thickness, or border color, etc. according to user-configurable colors and visualization schemes
- Layout networks in two dimensions. A variety of layout algorithms are available, including cyclic and spring-embedded layouts
- Zoom in/out and pan for browsing the network
- Use the network manager to easily organize multiple networks, with this structure savable in a session file
- Use the bird’s eye view to easily navigate large networks
- Easily navigate large networks (100,000+ nodes and edges) by efficient rendering engine
- Multiple plugins are available for areas such as subset selections, analysis, path analysis, etc. (see below).
Other Cytoscape Resources
The Cytoscape project also offers:
- An excellent PDF manual
- Online tutorials, and
- A Google discussion group at http://groups.google.com/group/cytoscape-discuss/topics.
Unfortunately, other than these official resources, there appears to be a dearth of general community discussion and tips on the Web. Here’s hoping that situation soon changes!
Plugins
There is a broad suite of plugins available for Cytoscape, and directions to developers for developing new ones.
The master page also includes third-party plugins. The candidates useful to UMBEL and its graphing needs — also applicable to standard semantic Web applications — appear to be:
- AgilentLiteratureSearch – creates a CyNetwork based on searching the scientific literature. Download from here
- BubbleRouter – this plugin allows users to layout a network incrementally and in a semi-automated way. Bubble Router arranges specific nodes in user-drawn regions based on a selected attribute value. Bubble Router works with any node attribute file. Download from here
- Cytoscape Plugin (Oracle) – enables a read/write interface between the Oracle database and the Cytoscape program. In addition, it also enables some network analysis functions from cytoscape. The README.txt file within the zipfile has instructions for installing and using this plugin. Download from here
- DOT – interfaces with the GraphViz package for graph layout. The plugin now supports both simple and rank-cluster layouts. This software uses the dot layout routine from the graphviz opensource software developed at AT&T labs. Download from here
- EnhancedSearch – performs search on multiple attribute fields. Download from here
- HyperEdgeEditor – add, remove, and modify HyperEdges in a Cytoscape Network. Download from here
- MCODE – MCODE finds clusters (highly interconnected regions) in a network. Clusters mean different things in different types of networks. For instance, clusters in a protein-protein interaction network are often protein complexes and parts of pathways, while clusters in a protein similarity network represent protein families. Download from here
- MONET – is a genetic interaction network inference algorithm based on Bayesian networks, which enables reliable network inference with large-scale data(ex. microarray) and genome-scale network inference from expression data. Network inference can be finished in reasonable time with parallel processing technique with supercomputing center resources. This option may also be applicable to generic networks. Download from here
- NamedSelection – this plugin provides the ability to “remember” a group of selected nodes. Download from here
- NetworkAnalyzer – computes network topology parameters such as diameter, average number of neighbors, and number of connected pairs of nodes. It also displays diagrams for the distributions of node degrees, average clustering coefficients, topological coefficients, and shortest path lengths. Download: http://med.bioinf.mpi-inf.mpg.de/netanalyzer/index.html
- SelConNet – is used to select the connected part of a network. Actually, running this plugin is like calling Select -> Nodes -> First neighbors of selected nodes many times until all the connected part of the network containing the selected nodes is selected. Download from here
- ShortestPath – is a plugin for Cytoscape 2.1 and later to show the shortest path between 2 selected nodes in the current network. It supports both directed and undirected networks and it gives the user the possibility to choose which node (of the selected ones) should be used as source and target (useful for directed networks). The plugin API makes possible to use its functionality from another plugin. Download from here
- sub-graph – is a flexible sub-graph creation, node identification, cycle finder, and path finder in directed and undirected graphs. It also has a function to select the p-neighborhood of a selected node or group of nodes which can be selected by pathway name, node type, or by a list in a file. This generates a set of plug-ins called: path and cycle finding, p-neighborhoods and sub-graph selection. Download from here.
Importantly, please note there is a wealth of biology- and molecular-specific plugins also available that are not included in the generic listing above.
Initial Use Tips
Our initial use of the tool suggests some use tips:
- Try Cytoscape with the yFiles layouts; quicker to perform, and interesting results
- Try the Organic yFile layout as one of the first
- Try the search feature
- Check the manual for examples of layouts
- Holding the right mouse button down when in the main screen; moving the cursor from the center outward causes zoom in, from the exterior inward, to zoom out
- Moving and panning nodes can be done in real time without issues
- The “edge attribute browser” is really nice to find what node links to what other node by clicking on a link (so you don’t have to pan and check, etc)
- Export to PDF often works best as an output display (though SVG is also supported)
- If you select an edge and then Ctrl-left-click on the edge, an edge “handle” will appear. This handle can be used to change the shape of the line
- Use the CSV file to make quick modifications, and then check it with the Organic layout
- A convenient way to check the propagation of a network is to select a node, then click on Ctrl+6 again and again (Ctrl+6 selects neighborhood nodes of a selected node, so it “shows” you the network created by a node and its relationships)
- If you want to analyze a sub-graph, search for a node, then press a couple of times on Ctrl+6, then create another graph from that selected node (File -> New -> Network from selected node)
- If you begin to see slow performance, then save and re-load your session; there appears to be some memory leaks in the program
- Also, for very large graphs, avoid repeated use of certain layouts (Hierarchy, Orthogonal, etc.) that take very long times to re-draw.
Concluding Observations and Comments
Cytoscape was first released in 2002 and has undergone steady development since. Most recently, the 2.x and especially 2.3 versions forward have seen a flurry of general developments that have greatly broadened the tool’s appeal and capabilities. It was perhaps only these more recent developments that have positioned Cytoscape for broader use.
I suspect another reason that this tool has been overlooked by the general semWeb community is the fact that its sponsors have positioned it mostly in the biological space. Their short descriptor for the project, for example, is: Cytoscape is an open source bioinformatics software platform for visualizing molecular interaction networks and integrating these interactions with gene expression profiles and other state data. That statement hardly makes it sound like a general tool!
Another reason for the lack of attention, of course, is the common tendency for different disciplines not to share enough information. Indeed, one reason for my starting the Sweet Tools listing was hopefully as a means of overcoming artificial boundaries and assembling relevant semantic Web tools in one central place.
Yet despite the product’s name and its positioning by sponsors, Cytoscape is indeed a general graph visualization tool, and arguably the most powerful one reviewed from our earlier list. Cytoscape can easily accommodate any generalized graph structure, is scalable, provides all conceivable visualization and modeling options, and has a clean extension and plugin framework for adding specialized functionality.
With just minor tweaks or new plugins, Cytoscape could directly read RDF and its various serializations, could support processing any arbitrary OWL or RDF-S ontology, and could support other specific semWeb-related tasks. As well, a tool like CPath (http://www.pubmedcentral.nih.gov/articlerender.fcgi?artid=1660554), which enables querying of biological databases and then storing them in Cytoscape format, offers some tantalizing prospects for a general model for other Web query options.
For these reasons, I gladly announce Cytoscape as the next deserving winner of the (highly coveted, but cheesy! ![]() ) AI3 Jewels & Doubloons award.
) AI3 Jewels & Doubloons award.
Cytoscape’s sponsors — the U.S. National Institute of General Medical Sciences (NIGMS) of the National Institutes of Health (NIH), the U.S. National Science Foundation (NSF) and Unilever PLC — and its developers — the Institute for Systems Biology, the University of California – San Diego, the Memorial Sloan-Kettering Cancer Center, L’Institut Pasteur and Agilent Technologies — are to be heartily thanked for this excellent tool!
|
An AI3 Jewels & Doubloons Winner |

Added it to my SVG links page http://svg.startpagina.nl
Just a note. I’ve developed a plugin to visualize RDF within Cytoscape (plus queries, reasoning and other options). It’s available at: http://bioinformatics.org/rdfscape/