Author’s Note: This is an on line version of a paper that Mike Bergman recently released under the auspices of BrightPlanet Corp. This version lacks a technical appendix with further references from the standard published long version.
The citation for this effort is:
M.K. Bergman, “Untapped Assets: The $3 Trillion Value of U.S. Enterprise Documents,” BrightPlanet Corporation White Paper, July 2005, 42 pp.
 Click here to obtain a copy of the long version (42 pp, 239 K)
Click here to obtain a copy of the short version (5 pp, 51 K)
EXECUTIVE SUMMARY
Today, in the advanced knowledge economy of the United States, the information contained within documents represents about a third of total gross domestic product, or an amount of about $3.3 trillion annually.
Yet our understanding of the value of documents and the means to manage them is abysmal. These failures impact enterprises of all sizes from the standpoints of revenues, profitability and reputation. Continued national productivity growth — and thus the wealth of all citizens — depends critically on understanding and managing these document values.
As this white paper describes, the lack of a compelling and demonstrable common understanding of the importance of documents is in itself a major factor limiting available productivity benefits. There is an old Chinese saying that roughly translated is “what cannot be measured, cannot be improved.” Many corporate officers may believe this to be the case for document creation and productivity, but, as this paper shows, in fact many of these document issues can be measured.
To wit, some 25% of all of the annual trillions of dollar spent on document creation costs lend themselves to actionable improvements:
| U.S. FIRMS |
$ Million
|
%
|
| Cost to Create Documents |
$3,261,091
|
|
|
|
|
| Benefits to Finding Missed or Overlooked Documents |
$489,164
|
63%
|
| Benefits to Improved Document Access |
$81,360
|
10%
|
| Benefits of Re-finding Web Documents |
$32,967
|
4%
|
|
|
|
| Benefits of Proposal Preparation and Wins |
$6,798
|
1%
|
| Benefits of Paperwork Requirements and Compliance |
$119,868
|
15%
|
| Benefits of Reducing Unauthorized Disclosures |
$51,187
|
7%
|
|
|
|
| Total Annual Benefits |
$781,314
|
100%
|
|
|
|
| PER LARGE FIRM |
$ Million
|
|
| Cost to Create Documents |
$955.6
|
|
|
|
|
| Benefits to Finding Missed or Overlooked Documents |
$143.3
|
|
| Benefits to Improving Document Access |
$23.8
|
|
| Benefits of Re-finding Web Documents |
$9.7
|
|
|
|
|
| Benefits of Proposal Preparation and Wins |
$2.0
|
|
| Benefits of Paperwork Requirements and Compliance |
$35.1
|
|
| Benefits of Reducing Unauthorized Disclosures |
$15.0
|
|
|
|
|
| Total Annual Benefits |
$229.0
|
|
Table 1. Mid-range Estimates for the Annual Value of Documents, U.S. Firms, 2002[1]
The total benefit from improved document access and use to the U.S economy is on the order of $800 billion annually, or about 8% of GDP. For the 1,000 largest U.S. firms, benefits from these improvements can approach nearly $250 million annually per firm. About three-quarters of these benefits arise from not re-creating the intellectual capital already invested in prior document creation. About one-quarter of the benefits are due to reduced regulatory non-compliance or paperwork, or better competitiveness in obtaining solicited grants and contracts.
Indeed, even these figures likely severely underestimate the benefits to enterprises from an improved leverage of document assets. It has always been the case that the best and most successful companies have been able to make better advantage of their intellectual assets than their competitors. The competitiveness advantage from better document access and use alone may exceed the huge benefits in the table above.
Documents — that is, unstructured and semi-structured data — are now at the point where structured data was at 15 years ago. At that time, companies realized that consolidating information from multiple numeric databases would be a key source of competitive advantage. That realization led to the development and growth of the data warehousing or business intelligence markets, now representing about $3.9 billion in annual software sales.
Search and enterprise content management software today only represents a fraction of that amount — perhaps on the order of $500 million annually. But given that intellectual content in documents represents three to four times the amount in numeric structured data, it is clear that document software capabilities are not being well utilized, reaching only a small fraction of their market potential.
The estimates provided by BrightPlanet in this white paper are drawn from numerous sources and are extremely fragmented, perhaps even inconsistent. One hope in preparing this document was to stimulate more research attention and data gathering around the critical issues of document value to the enterprise and the economy at large.
EXECUTIVE SUMMARY. 1
I. INTRODUCTION. 3
Documents: The Drivers of a Knowledge Economy. 3
Documents: The Linchpin of Corporate Intellectual Assets. 4
Documents: Unknown Value, Huge Implications. 4
Documents: The Next Generation of Data Warehousing?. 6
Connecting the Dots: A Pointillistic Approach. 6
II. INTERNAL DOCUMENTS. 7
Number of ‘Valuable’ Documents Produced per Firm.. 7
Total Annual U.S. ‘Costs’ to Create Documents. 8
‘Cost’ of Creating a ‘Typical’ Document 9
‘Cost’ of a Missed or Overlooked Document 9
Other Document Total ‘Cost’ Factors and Summary. 9
Archival Lifetime of ‘Valuable’ Documents. 10
III. WEB DOCUMENTS AND SEARCH. 10
Estimate of Time and Effort Devoted to Document Search. 11
Effect of Non-persistent Search Efforts. 11
‘Cost’ of Creating and Maintaining a Document Category Portal 14
‘Cost’ of Inaccessible or Hidden Intranet Sites. 16
IV. OPPORTUNITIES AND THREATS. 18
‘Costs’ and Opportunity Costs of Winning Proposals. 18
‘Costs’ of Regulation and Regulatory Non-compliance. 21
‘Cost’ of an Unauthorized Posted Document 24
V. CONCLUSIONS. 25
I. INTRODUCTION
How many documents does your organization create each year? What effort does this represent in terms of total staffing costs? What does it cost to create a ‘typical’ document? Of documents created, how much of the value in them is readily sharable throughout your organization? How long do you need to keep valuable documents and how can you access them? How much existing document content is re-created simply because prior work cannot be found? When prior information is missed, what do these prior investments in documents represent in terms of loss of market share, revenue or reputation? Indeed, what does the term, “document” represent in your organization’s context?
If you have difficulty answering these questions, you are not alone. Depending on the survey, from 90% to 97% of enterprises cannot answer these questions — in whole or in part. The purpose of this white paper is to provide the first comprehensive assessment ever of these document values.
Enterprises and the analyst community have historically overlooked the impact of document creation as opposed to document handling. Document creation is about 2-3 times more important — from an embedded cost standpoint — than document handling. Second, all aspects of document creation, and later access and use, assume a much greater role in the overall economics of enterprises than have been realized previously.
Documents: The Drivers of a Knowledge Economy
Put your index finger one inch from your nose. That is how close — and unfocused — document importance is to an organization. Documents are the salient reality of a knowledge economy, but like your finger, documents are often too close, ubiquitous and commonplace to appreciate.
How do your employees earn their livings? Writing proposals? Marketing or selling? Evaluating competitors or opportunities? Persuading? Analyzing? Communicating? Teaching? Of course, in some sectors, many make their living from growing things or making things. These are essential jobs — indeed, until the last few decades were the predominant drivers of economies — but are now being supplanted in advanced economies by knowledge work. Perhaps up to 35% of all company employees in the U.S. can be classified as knowledge workers.
And knowledge work means documents. The fact is that knowledge is produced and communicated through the written word. When we search, when we write, when we persuade, we may often do so verbally but make it persistent through the written word.
Documents: The Linchpin of Corporate Intellectual Assets
IBM estimates that corporate data doubles every six to eight months, 85% of which are documents.[2] At least 10% of an enterprise’s information changes on a monthly basis.[3] Year-on-year office document growth rates are on the order of 22%.[4] As later analysis indicates, there are perhaps on the order of 10 billion documents created annually in the U.S with a mid-range “asset” value of $3.3 trillion per year. Documents are a huge contributor to the United States’ gross domestic product of $10.5 trillion (2002).
- According to a Coopers & Lybrand study in 1993:[5]
- Ninety percent of corporate memory exists on paper
- Ninety percent of the papers handled each day are merely shuffled
- Professionals spend 5-15 percent of their time reading information, but up to 50 percent looking for it
- On average, 19 copies are made of each paper document.
A Xerox Corporation study commissioned in 2003 and conducted by IDC surveyed 1000 of the largest European companies and had similar findings:[6],[7]
- On average 45% of an executive’s time was spent dealing with documents
- 82% believe that documents were crucial to the successful operation of their organizations
- A further 70% claimed that poor document processes could impact the operational agility of their organizations
- While 83%, 78% and 76% consider faxes, email and electronic files as documents, respectively, only 48% and 46% categorize web pages and multimedia content as such.
Documents: Unknown Value, Huge Implications
But, if defining what constitutes a document is hard, identifying the costs associated with all the document activities is almost impossible for many organizations. Ninety to 97 percent of the corporate respondents to the Coopers & Lybrand and Xerox studies, respectively, could not estimate how much they spent on producing documents each year. Almost three quarters of them admit that the information is unavailable or unknown to them.
An A.T. Kearney study sponsored by Adobe, EDS, Hewlett-Packard, Mayfield and Nokia, published in 2001, estimated that workforce inefficiencies related to content publishing cost organizations globally about $750 billion. The study further estimated that knowledge workers waste between 15% to 25% of their time in non-productive document activities.[8]
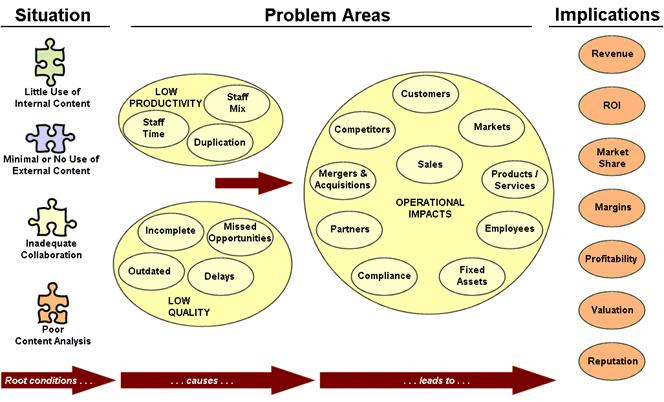
Figure 1. The Situation of Poor Enterprise Document Use Leads to Real Implications
But the situation is much broader and results in part from the inability to quantify the importance of both internal and external document assets to all aspects of the enterprise’s bottom line. For examples drawn from the main body of this white paper, early adopters of enterprise content software typically capture less than 1% of valuable internal documents available; large enterprises are witnessing the proliferation of internal and external Web sites, sometimes exceeding thousands; use of external content is presently limited to Internet search engines, producing non-persistent results and no capture of the investment in discovery or results; and “deep” content in searchable databases, which is common to large organizations and represents 90% of external Internet content, is completely untapped.
A USC study reported that typically only 32% of employees in knowledge organizations have access to good information about technical developments relevant to their work, and 79% claim they have inadequate information about what their competitors are doing.[9]
The enterprise content integration software market is fragmented and confused, with only a few established companies providing partial solutions. Content integration is still a small market with annual revenues of less than $50 million worldwide.[10] Vendor offerings fail to satisfy customer needs because of a lack of functionality and a lack of scalability to enterprise volumes. Sales in the market remain distinctly lower than those projected by industry analysts, even as the magnitude of “information overload” continues to grow at a dramatic rate.
Documents: The Next Generation of Data Warehousing?
Documents — that is, unstructured and semi-structured data — are now at the point where structured data was at 15 years ago. At that time, companies realized that consolidating information from multiple numeric databases would be a key source of competitive advantage. That realization led to the development and growth of the data warehousing or business intelligence markets, now representing about $3.9 billion in annual software sales.[11]
Certain categories of businesses have been leaders in content integration, especially those that have recently had mergers and acquisitions activity, those that need to integrate business applications with content, and those for which the reuse of marketing assets across the organization is critical.10
Stonebraker and Hellerstein have provided an insightful roadmap for how enterprise data integration or “federation” has trended over time: Data warehousing → Enterprise application integration → Enterprise content integration → Enterprise information integration.[12] There are two threads to this trend. First, there has been a growing recognition of the importance of document (unstructured) content to contribute to actionable information. Second, increasingly unified and integrated means are being applied to all data sources to allow single-access retrievals.
Connecting the Dots: A Pointillistic Approach
The state of information regarding the value and cost of documents is extremely poor. Lack of defensible and vetted estimates for this information undercuts the ability to properly estimate the intellectual assets tied up in documents or the impacts of overlooked or misused documents.
Only three large document studies — the Coopers & Lybrand, Xerox and A.T. Kearney studies noted above — have been conducted in the past ten years regarding the use and importance of documents within enterprises, and then solely from the standpoint of executive perceptions.
The quantified picture presented in this white paper regarding the costs and benefits of document creation, access and use is a paint-by-the-numbers assemblage of disparate data. The paper draws upon about 80 different data sources, many fragmented. The analysis approach by necessity has needed to conjoin assumptions and data from many diverse sources.
This approach leads to both uncertainty regarding “true” values and likely inaccuracies or mis-estimates in some areas. To make the assessment as consistent as possible, a base year of 2002 was used, the common year reference for most of the available data sources. To bracket uncertainties, most estimates are provided in low, medium and high estimates.
Thus, this study should be viewed as preliminary, but strongly indicative of the value of documents. Further research and data collection will surely refine these estimates. Clearly, though, by any measure, the value of documents to the enterprise is significant and huge, and should not continue to be overlooked.
II. INTERNAL DOCUMENTS
Though valuable content resides everywhere, the first challenge to enterprises is getting a handle on their own internal document content.
Number of ‘Valuable’ Documents Produced per Firm
A recent UC Berkeley study on “How Much Information?” estimated that more than 4 billion pages of internal office documents with archival value are generated annually in the U.S. (Note: this is not the amount created, only those documents deemed worthy of retaining for more than one year).
|
Firm Size (employees)
|
1-9
|
10-19
|
20-99
|
100-499
|
500-999
|
1000-2500
|
2500-9999
|
>10,000
|
| Firms |
3,716,944
|
616,064
|
518,258
|
85,304
|
8,572
|
5,161
|
2,704
|
930
|
| Employees |
12,328,094
|
8,274,541
|
20,370,447
|
16,410,367
|
5,906,266
|
7,894,226
|
12,519,664
|
31,357,579
|
| Knowledge Workers |
2,217,093
|
1,488,099
|
3,663,435
|
2,951,251
|
1,062,187
|
1,419,703
|
2,251,545
|
5,639,368
|
| Number of Pages – Low |
465,842,666
|
312,670,737
|
769,739,697
|
620,099,840
|
223,180,542
|
298,299,744
|
473,081,537
|
1,184,911,325
|
| Number of Pages – High |
1,164,606,665
|
781,676,843
|
1,924,349,242
|
1,550,249,599
|
557,951,355
|
745,749,360
|
1,182,703,842
|
2,962,278,313
|
| Number of Docs – Low |
46,584,267
|
31,267,074
|
76,973,970
|
62,009,984
|
22,318,054
|
29,829,974
|
47,308,154
|
118,491,133
|
| Number of Docs- High |
116,460,666
|
78,167,684
|
192,434,924
|
155,024,960
|
55,795,135
|
74,574,936
|
118,270,384
|
296,227,831
|
| Docs/Firm – Low |
13
|
51
|
149
|
727
|
2,604
|
5,780
|
17,496
|
127,410
|
| Docs/Firm – High |
31
|
127
|
371
|
1,817
|
6,509
|
14,450
|
43,739
|
318,525
|
| Docs/Firm – 3 yr Low |
38
|
152
|
446
|
2,181
|
7,811
|
17,340
|
52,487
|
382,229
|
| Docs/Firm – 5 yr High |
157
|
634
|
1,857
|
9,087
|
32,545
|
72,249
|
218,695
|
1,592,623
|
|
|
|
|
|
|
|
|
|
| Content Management Workers |
105,709
|
70,951
|
174,670
|
140,713
|
50,644
|
67,690
|
107,352
|
268,881
|
| CMWs/Firm |
0
|
0
|
0
|
2
|
6
|
13
|
40
|
289
|
Table 2. Document Projections for U.S. Firms by Size, 2002 Basis
Sources: UC Berkeley[13], U.S. Commerce Department[14], U.S. Bureau of Labor Statistics[15], U.S. Census Bureau[16]
Table 2 and Table 3 attempt to summarize the scale of this challenge for U.S. firms (for internal enterprise documents only). (See[17] for a description of methodology regarding document scales, note[18] for estimating the numbers of enterprise knowledge workers, and note[19] for estimating content workers. A rough multiplier of 3x to 4x can be applied to extrapolate globally.[20]) Breakouts are provided by size of firm; these include estimates for the number of knowledge and content workers within U.S. firms.
|
Category
|
Value
|
| Firms |
4,953,937
|
| Employees |
127,273,960
|
| Knowledge Workers |
20,692,680
|
| Annual Number of Docs – Low |
9,291,013,320
|
| Annual Number of Docs- High |
21,739,130,435
|
| Annual Docs/Firm – Low |
1,875
|
| Annual Docs/Firm – High |
4,388
|
| Total Docs/Firm – 3 yr Low |
1,990
|
| Total Docs/Firm – 5 yr High |
5,601
|
|
|
| Content Management Workers |
986,610
|
| CMWs/Firm |
0.2
|
Table 3. Total Annual Document Projections for U.S. Firms, 2002 Basis
Table 4 takes this information and breaks out distribution of document production for a ‘typical’ knowledge worker according to major document types. The data from this table is based on analysis of dozens of BrightPlanet customers averaged across about 10 million documents in various repositories.
|
|
|
|
|
|
|
|
% Based On
|
|
All
|
Unique
|
MBs
|
KB/Page
|
Pg/Doc
|
Pages
|
|
Docs
|
MBs
|
Pages
|
| Archival Documents (3 yrs) |
|
|
|
|
|
|
|
|
|
| DOC |
|
281
|
59
|
20
|
10.5
|
2,938
|
|
52%
|
36%
|
50%
|
| PDF |
|
46
|
28
|
14
|
43.6
|
2,017
|
|
9%
|
17%
|
34%
|
| PPT |
|
32
|
26
|
55
|
14.6
|
474
|
|
6%
|
16%
|
8%
|
| XLS |
|
178
|
51
|
100
|
2.7
|
484
|
|
33%
|
31%
|
8%
|
| Weighted |
|
537
|
164
|
28
|
11.0
|
5,912
|
|
100%
|
100%
|
100%
|
| Current Documents (I yr) |
|
|
|
|
|
|
|
|
|
| DOC |
221
|
|
71
|
20
|
5.1
|
1,127
|
|
49%
|
35%
|
32%
|
| PDF |
66
|
|
36
|
14
|
24.7
|
1,634
|
|
15%
|
18%
|
46%
|
| PPT |
53
|
|
76
|
55
|
12.9
|
687
|
|
12%
|
38%
|
20%
|
| XLS |
108
|
|
17
|
100
|
0.6
|
70
|
|
24%
|
8%
|
2%
|
| Weighted |
449
|
|
199
|
57
|
7.8
|
3,517
|
|
100%
|
100%
|
100%
|
| Total per Employee |
|
|
|
|
|
|
|
|
|
| DOC |
502
|
129
|
20
|
8.1
|
4,065
|
|
51%
|
36%
|
43%
|
| PDF |
112
|
64
|
14
|
32.5
|
3,650
|
|
11%
|
18%
|
39%
|
| PPT |
86
|
102
|
55
|
13.5
|
1,161
|
|
9%
|
28%
|
12%
|
| XLS |
285
|
68
|
100
|
1.9
|
554
|
|
29%
|
19%
|
6%
|
| Weighted |
986
|
363
|
39
|
9.6
|
9,430
|
|
100%
|
100%
|
100%
|
Table 4. Document Production for a ‘Typical’ Knowledge Worker
Note that word processed documents account for about 50% of typical production and storage demands. However, also note that documents of the highest archival value, as converted to PDFs for sharing and deployment, also represent about a third to two-fifths of stored documents.
Total Annual U.S. ‘Costs’ to Create Documents
Based on the information from Table 2 to Table 4 above, all updated to a common year 2002 basis, BrightPlanet is able to estimate the total annual costs in the U.S. for creating all internal enterprise documents. The analysis is based on the UC Berkeley information and the Coopers & Lybrand studies. The “bottom up” case is based on the number of annual U.S. documents estimated based on Table 2. These results are shown in the table below:
|
Annual U.S. Office Documents
|
|
Number (M)
|
$/Document
|
Total $ (B)
|
| “Bottom Up” – Low |
1,387
|
$738.58
|
$1,024
|
| “Bottom Up” – High |
7,242
|
$141.43
|
$1,024
|
| Coopers & Lybrand |
11,975
|
$272.33
|
$3,261
|
| C&L – UCB |
27,737
|
$272.33
|
$7,554
|
| C&L – “Bottom Up” |
4,315
|
$272.33
|
$1,175
|
|
|
|
|
| Average |
10,531
|
$384.11
|
$3,253
|
Table 5. Annual U.S. Office Document Cost Estimates[21]
The average numbers above represent the average of the unique values in each column. The Table 5 analysis suggests there may be on the order of 10 billion documents created annually in the U.S with a total “asset” value on the order of $3.3 trillion per year.
‘Cost’ of Creating a ‘Typical’ Document
Based on the averages in the table above, a ‘typical’ document may cost on the order of $380 each to create.[22] Of course, a “document” can vary widely in size, complexity and time to create, and therefore its individual cost and value will vary widely. An invoice generated from an automated accounting system could be a single page and produced automatically in the thousands; proposals for very large contracts can take tens of thousands to millions of dollars to create. For examples, here are some other ‘typical’ costs for a variety of documents:
|
Ave. Cost
|
| ‘Typical’ Document |
$384.11
|
|
|
|
|
| Invoice |
$4.43
|
[23] |
| Mortgage Application |
$210.00
|
[24] |
| ‘Typical’ Proposal |
$17,500.00
|
[25] |
Table 6. ‘Typical’ per Document Creation Costs
Depending on document mix and activities, individual enterprises may want to vary the average document creation costs used in their cost-benefit estimates.
‘Cost’ of a Missed or Overlooked Document
The Coopers & Lybrand study suggests that 7.5 percent of all documents are lost forever, and that it costs $120 in labor ($150 updated to 2002) to find a misfiled document;[26] other studies suggest that 5% to 6% of documents are routinely misplaced or misfiled.
In fact, the extent of this problem is unknown and is affirmed by the Xerox results:[27]
- Almost three quarters of corporate respondents admit that the information is unavailable or unknown to them
- 95% of the companies are not able to estimate the cost of wasted or unused documents
- On average 19% of printed documents were wasted.
Other Document Total ‘Cost’ Factors and Summary
Five independent studies suggest that, on average, organizations spend from 5% to 15% of total company revenue on handling documents.27,[28],[29],[30],[31] These seemingly innocuous percentages can translate into huge bottom-line impacts for U.S. enterprises. For example, the total GDP of the United States was on the order of $10.5 trillion at the end of 2002.[32] Translating this value into the results of Table 5 and the information in previous sections indicates the importance of document creation and handling for U.S enterprises:
|
Low
|
Medium
|
High
|
| Total U.S. Gross Domestic Product ($B) |
$10,487
|
$10,487
|
$10,487
|
|
|
|
|
| Total Document Handling ($B) |
$524
|
$1,049
|
$1,573
|
|
% of total GDP:
|
5.0%
|
10.0%
|
15.0%
|
|
|
|
|
| Total Document Creation ($B) |
$1,100
|
$3,261
|
$7,554
|
|
% of total GDP:
|
10.5%
|
31.1%
|
72.0%
|
|
|
|
|
| Total Document Misfiled ($B) |
$32
|
$81
|
$160
|
|
% of total GDP:
|
0.3%
|
0.8%
|
1.5%
|
|
|
|
|
| ALL U.S. Document Burdens ($B) |
$1,656
|
$4,390
|
$9,287
|
|
% of total GDP:
|
15.8%
|
41.9%
|
88.6%
|
Table 7. Range Estimates for Total U.S. Document Burdens in Enterprises, 2002[33]
A few observations relate to this table. First, enterprises and the analyst community have greatly overlooked the impact of document creation as opposed to document handling. Document creation is about 2-3 times more important – from an embedded cost standpoint – than document handling. Second, all aspects of document creation assume a much greater role in the overall economics of enterprises than has been realized previously.
The fact that documents have received so little management attention, awareness, measurement and direct attention to improve performance is shocking.
Archival Lifetime of ‘Valuable’ Documents
The ‘low’ and ‘high’ estimates for documents in Table 2 and Table 3 assume that 2% and 5%, respectively, of internal documents have archival value. Were these percentages to be higher, the volume of documents requiring integration and access would likewise increase. The 2% value is derived from the UC Berkeley study,[34] which also refers to an unpublished European study that places archival amounts at 10%. Unfortunately, there is little empirical information to support the degree to which documents deserve to be kept for archival purposes.
Assuming that documents may retain value for three to five years, the largest firms perhaps have as many as 4 million internal documents on average with enterprise-wide value. Firms with fewer employees generally have lower document counts. Archival percentages, however, are a tricky matter, since apparently 85% of all archived documents are accessed.[35]
III. WEB DOCUMENTS AND SEARCH
Various estimates by Cowles/Simba,[36] Veronis, Suhler & Associates,[37] and Outsell[38] place the current market for on line business information in the $30 billion to $140 billion range, with significant projected growth. Outsell also indicates that marketing, sales, and product development professionals rely most heavily on information from the Internet for their daily decision making, based on a comparative study of Fortune 500 business professionals’ use of the open Web and fee-based desktop information content services.[39] Clearly, relevant and targeted content, much of which resides on line, has extreme value to enterprises.
UC Berkeley estimates that about 500 petabytes of new information was published on the Web in 2002,34 based on original analysis conducted by BrightPlanet.[40] The compound growth rate in Web documents has been on the order of more than 200% annually.[41] Estimates for deep Web content range from about 6-8 times larger [42] to 500 times larger40 than standard “surface web” content. The size of Internet content is overwhelming, of highly variable quality, growing at a rapid pace, and with much of its content ephemeral.
Estimate of Time and Effort Devoted to Document Search
According to a recent study by iProspect, about 56 percent of users use search engines every day, based on a population of which more than 70 percent use the Internet more than 10 hours per week. Professionals abandon a current search 38% of the time after inspecting only one results page (the listing of document result URLs), and overall 82% of users attempt another search if relevant results are not found within the first three results pages. Just 13 percent of users said that they use different search engines for different types of searches.[43] Only 7.5 percent of Internet users said they refined their search with additional keywords in cases where they were unable to achieve satisfactory results.[44]
The average knowledge worker spends 2.3 hrs per day – or about 25% of work time – searching for critical job information.[45] IDC estimates that enterprises employing 1,000 knowledge workers waste well over $6 million per year each in searching for information that does not exist, failing to find information that does, or recreating information that could have been found but was not.[46] As that report stated, “It is simply impossible to create knowledge from information that cannot be found or retrieved.”
Vendors and customers often use time savings by knowledge workers as a key rationale for justifying a document or content initiative. This comes about because many studies over the years have noted that white collar employees spend a consistent 20% to 25% of their time seeking information; the premise is that more effective search will save time and drop these percentages. As a sample calculation, each 1% reduction in time devoted to search produces:
$50,000 (base salary) * 1.8 (burden rate) * 1.0% = $900/ employee
The stable percentage effort devoted to search over time suggests it is the “satisficing” allocation. (In other words, knowledge workers are willing to devote a quarter of their time to finding relevant information.) Thus, while better tools to aid better discovery may lead to finding better information and making better decisions more productively – a far more important justification in itself – there may not result a strict time or labor savings from more efficient search.[47]
Effect of Non-persistent Search Efforts
The percentage of Web page visits that are re-visits is estimated at between 58%[48] and 80%.[49] While many of these re-visitations occur shortly after the first visit (e.g., during the same session using the back button), a significant number occur after a considerable amount of time has elapsed. Thus, it is not surprising that a survey of problems using the Web found “Not being able to find a page I know is out there,” and “Not being able to return to a page I once visited,” accounted for 17% of the problems reported, and that the most common problem using bookmarks was, “Changed content.”[50] Depending on the content type, users use either “direct” or “indirect” approaches to re-find previously discovered information:
|
Direct
|
Indirect
|
| Specific Information |
42%
|
58%
|
| General Information |
58%
|
43%
|
| Specific Documents |
29%
|
71%
|
| Web Documents |
77%
|
23%
|
| Emails |
9%
|
91%
|
Table 8. General Approaches to Re-finding Previously Discovered Information [51]
Direct approaches require remembering or specifically noting the specific location of the information. Direct approaches include: direct entry; emailing to self; emailing to others; printing out; saving as file; pasting the URL into a document; and posting to a personal Web site.
Indirect approaches include: searching; looking through bookmarks; and recalling from a history file. All of these indirect approaches are supported by modern browsers. Note that re-finding Web pages or documents relies heavily on having a record of a previously visited URL.
As a University of Washington study supported by Microsoft discovered, all of the specific direct and indirect techniques applied to these re-discovery approaches have significant drawbacks in terms of desired functions for the recall process: [52]
|
Portability |
No of Access Points |
Persistence |
Preservation |
Currency |
Context |
Reminding |
Ease of Integration |
Communication |
Ease of Maintenance |
|
DIRECT APPROACHES
|
|
|
|
|
|
|
|
|
|
| Direct Entry |
Low
|
High
|
Low
|
Med
|
High
|
Low
|
Low
|
?
|
Low
|
High
|
| Email to Self |
Low
|
High
|
Low
|
Med
|
High
|
High
|
High
|
Med
|
Low
|
Med
|
| Email to Others |
Low
|
High
|
Low
|
Med
|
High
|
High
|
Low
|
Low?
|
High
|
High
|
| Print-out |
High
|
High
|
High
|
Low
|
Low
|
Low
|
High
|
Med
|
High
|
Med
|
| Save as File |
Med?
|
Low?
|
High
|
High
|
Low
|
Low
|
Low
|
Med?
|
Low
|
Med
|
| Paste URL in Doc |
Low
|
Low?
|
Low
|
Med
|
High
|
High
|
High?
|
High?
|
Low
|
High
|
| Personal Web Site |
Low
|
High
|
Low
|
Med
|
High
|
High
|
High?
|
High
|
Med
|
High?
|
|
INDIRECT APPROACHES
|
|
|
|
|
|
|
|
|
|
| Search |
Low
|
High
|
Low
|
Med
|
High
|
Low
|
Low
|
?
|
Low
|
High
|
| Bookmark |
Low
|
Low
|
Low
|
Med
|
High
|
Low
|
Low
|
Low
|
Low
|
Low
|
| History |
Low
|
Low
|
Low
|
Med
|
High
|
Low
|
Low
|
Low?
|
Low
|
?
|
Table 9. Strengths and Weakness of Existing Techniques to Re-use Web Information
The general observation is that no present technique is able alone to keep search persistent, current or maintain context. These combined inadequacies mean that previously found information is not easily found again, or re-discovered, as the following table shows:
|
Percent
|
| Information No Longer Available |
37%
|
| Re-tracing Path Fails |
14%
|
| Time Length Since Last Find |
9%
|
| Other Failure Reasons |
9%
|
|
Total Information Lost
|
68%
|
|
|
| Success Finding Lost Information |
32%
|
Table 10. Success in Finding Important Earlier Found Web Information [53]
This table has a number of important observations. First, some 37% of previously found information disappears from the Web, consistent with other findings that estimate about 40% of all Web content disappears annually, some of which has historical or archival value.[54]
Second, and most importantly, nearly 70% of previously found valuable information cannot be rediscovered again. More than half of this problem is because the information is no longer available on the Web, but other reasons relate to the inadequacies of recall techniques for finding previously discovered information.
These observations can translate into some relatively huge costs on a per employee and per enterprise basis, as the table below shows:
|
Per Knowledge Worker
|
Per ‘Large’
|
All
|
|
Per Doc
|
All Docs
|
Enterprise ($000)
|
Enterprises ($M)
|
| Re-finding Documents |
$148.54
|
$585
|
$3,547
|
$12,103
|
|
|
|
|
|
| Re-creating Documents |
$384.11
|
$1,008
|
$6,114
|
$20,864
|
|
|
|
|
|
| TOTAL |
|
$1,593
|
$9,661
|
$32,967
|
Table 11. ‘Cost’ of Not Readily Re-finding Valuable Web Information
This analysis assumes that some previously found information of value is again re-found (60%), but some is also not re-found and must be re-created (40%).[55] The ‘large’ enterprise is identical to the definition in Table 2 (which is also nearly equivalent to a Fortune 1000 company).[56]
The analysis indicates that poor methods to recall previously found and valuable Web documents may cost $1,600 per knowledge worker per year. This translates into nearly a $10 million productivity loss for the largest enterprises, or nearly $33 billion across all U.S. industries.
In relation to the total document costs noted in Table 7 above, these may seem to be comparatively small numbers. However, when viewed in the context of unproductive standard Web search, they indicate important failings in the ability to recall previously found valuable results from searches and their attendant productivity losses.
‘Cost’ of Creating and Maintaining a Document Category Portal
Users, administrators and industry analysts alike recognize the importance of placing content into logical, intuitive and hierarchically organized categories. About 60% of knowledge workers note that search is a difficult process, made all the more difficult without a logical organization to content.[57] While technical distinctions exist, these logical structures organized into a hierarchical presentation are most often referred to as “taxonomies,” though other terms such as ontology, subject directory, subject tree, directory structure or classification schema may be used.
Delphi Group’s research with corporate Web sites points to the lack of organized information as the number one problem in the opinion of business professionals. More than three-quarters of the surveyed corporations indicated that a taxonomy or classification system for documents is imperative or somewhat important to their business strategy; more than one-third of firms that classify documents still use manual techniques.57 Hierarchical arrangements of categorized subjects trigger associations and relationships that are not obvious when simply searching keywords. Other advantages cited for the taxonomic presentation of documents are the greater likelihood of discovery, ease-of-use, overcoming the difficulty of formulating effective search queries, being able to search only within related documents, discovery of relationships among similar terminology and concepts, and user satisfaction.[58],[59]
From the user standpoint, knowledge workers want to impose taxonomic order on document chaos, but only if the taxonomy models their domain accurately. They also want software to assist with categorizing, as long as it respects the taxonomy they created. Finally, the results of these category placements should be presented via a portal. Thus, as the common concern across all requirements, the taxonomy takes on tremendous importance for an application’s success.[60]
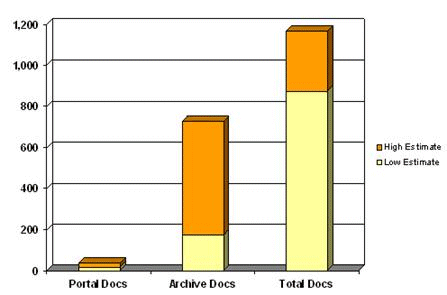
Figure 2. Typical Large Firm Documents, Thousands
Enterprises that have adopted directory structures for content management are not yet achieving enterprise-wide relevance, presenting on average 1% of all relevant documents in an organized portal view. These limitations appear to be driven by weaknesses in the technology and high costs associated with conventional approaches:
- Comprehensiveness and Scale – according to a market report published by Plumtree in 2003, the average document portal contains about 37,000 documents.[61] This was an increase from a 2002 Plumtree survey that indicated average document counts of 18,000.[62] However, about 60% of respondents to a Delphi Group survey said they had more than 50,000 internal documents in their portal environment (generally the department level), 3 and as Table 2 indicates above, most of the largest firms likely have millions or more internal documents deserving of common access and archiving.
- The left-hand bar in Figure 2 indicates current averages for documents in existing content portals. The right-hand (yellow and orange) bar indicates potential based on high and low estimates. The ‘Archive’ case (middle bar) show the same values as provided in Table 2, and represent a conservative view of “archival-likely” documents. The right bar is a more representative view of actual current internal content that enterprises may want to make available to their employees.[63] Two observations have merit: 1) under current practice, enterprises are at most making 10% of their useful documents available, and more likely slightly over 1%; 2) the documents that are being made available are solely internal, and neglect potentially important external sources that would increase document counts considerably.
- Implementation Times – though average time to stand-up a new content installation is about 6 months, there is also a 22% risk that deployment times exceeds that and an 8% risk it takes longer than one year. Furthermore, internal staff necessary for initial stand-up average nearly 14 people (6 of whom are strictly devoted to content development), with the potential for much larger head counts[64]
- Ongoing Maintenance and Staffing Costs – ongoing maintenance and staffing costs typically exceed the initial deployment effort. This trend is perhaps not surprising in that once a valuable content portal has been created there will be demands to expand its scope and coverage. Based on these various factors, Table 12 summarizes set-up, ongoing maintenance and key metrics for today’s conventional approaches versus what BrightPlanet can do (the BrightPlanet document count is based on a ‘typical’ installation; there are no practical scale limits)
|
DOCUMENT
|
INITIAL SET-UP
|
MAINTENANCE
|
|
BASIS
|
Staff
|
Mos
|
$/Doc
|
Staff
|
$/Doc
|
| Current Practice |
37,000
|
6.2
|
5.4
|
$4.861
|
6.4
|
$11.278
|
| BrightPlanet |
250,000
|
1.0
|
0.8
|
$0.017
|
0.3
|
$0.078
|
|
|
|
|
|
|
|
| BP Advantage |
6.8 x + up
|
6.2 x
|
6.7 x
|
280.4 x
|
21.4 x
|
144.6 x
|
Table 12. Staff, Time and per Document Costs for Categorized Document Portals
- The content staff level estimates in the table are consistent with anecdotal information and with a survey of 40 installations that found there were on average 14 content development staff managing each enterprise’s content portal.[65]
Though conventional approaches to content integration seem to lead to high per document set-up and maintenance costs, these should be contrasted with standard practice that suggests it may cost on average $25 to $40 per document simply for filing.29 Indeed, labor costs can account for up to 30% of total document handling costs.28 Nonetheless, at $5 to $11 per document for content management alone, this could result in no actual cost savings if electronic access does not displace current filing practices. When multiplied across all enterprise documents, these uncertainties can translate into huge swings in costs or benefits for a content portal initiative.
- Software License v. Full Project Costs – according to Charles Phillips of Morgan Stanley, only 30% of the money spent on major software projects goes to the actual purchase of commercially packaged software. Another third goes to internal software development by companies. The remaining 37% goes to third-party consultants.[66] In evaluating a commitment, internal staff and consulting time should be carefully scrutinized. Efficiencies in initial deployment and ongoing support are the biggest cost drivers
- Internal PLUS External Sources – weaknesses in scalability and high implementation costs often lead to a dismissal of the importance of integrating internal plus external content. Few installations address relevant content external to the enterprise essential to achieving its missions. Granted, the increase in scales associated with external content are large, but for some businesses integration with external content may be essential.
While other vendors claim fast categorization times, what they fail to mention is the lengthy pre-processing times necessary for generating their categorization metatags. According to Forrester Research, some of these metatagging systems can only process five to 15 documents per hour![67]
‘Cost’ of Inaccessible or Hidden Intranet Sites
In 2003, the portal vendor Plumtree noticed a new trend that it called “Web sprawl,” by which it meant the costly proliferation of Web applications, intranets and extranets.[68] BEA has taken up this trend as a major thrust to its Web service offerings through an approach it calls “enterprise portal rationalization” (EPR).[69] According to BEA, its architectural offerings are meant to control the “metastasizing” of corporate Web sites.
How common and to what scale is the proliferation of enterprise Web sites? BrightPlanet has not been able to find any comprehensive studies on this topic, but has been able to find many anecdotal examples. The proliferation, in fact, began as soon as the Internet became popular:
- As reported in 2000, Intel had more than 1 million URLs on its intranet with more than 100 new Web sites being introduced each month[70]
- In 2002, IBM consolidated over 8,000 intranet sites, 680 ‘major’ sites, 11 million Web pages and 5,600 domain names into what it calls the IBM Dynamic Workplaces, or W3 to employees[71]
- Silicon Graphics’ ‘Silicon Junction’ company-wide portal serves 7,200 employees with 144,000 Web pages consolidated from more than 800 internal Web sites[72]
- Hewlett-Packard Co., for example, has sliced the number of internal Web sites it runs from 4,700 (1,000 for employee training, 3,000 for HR) to 2,600, and it makes them all accessible from one home, @HP [73],[74]
- Avaya Corporation is now consolidating more than 800 internal Web sites globally[75]
- The Wall Street Journal recently reported that AT&T has 10 information architects on staff to maintain its 3,600 intranet sets that contain 1.5 million public Web pages[76]
- The new Department of Homeland Security is faced with the challenge of consolidating more than 3,000 databases inherited from its various constituent agencies.[77]
BrightPlanet’s customers confirm these trends, with indicators of hundreds if not thousands of internal Web sites common in the largest companies. Indeed, it is surprising how many instances there are where corporate IT does not even know the full extent of Web site proliferation. The problem is likely much greater than realized:
|
Low
|
Med
|
High
|
| Number of Large Firms |
930
|
1,500
|
3,000
|
| Ave Number of Web Sites per Firm |
100
|
500
|
900
|
| Ave. Number of Documents per Web Site |
100
|
350
|
1,500
|
| Total Large Firm Web Sites |
93,000
|
750,000
|
2,700,000
|
| Percentage of Known Web Sites |
85%
|
60%
|
40%
|
| Percentage of Doc Federation for Known Sites |
50%
|
10%
|
2%
|
|
|
|
|
| Site Development & Maintenance |
|
|
|
| Development Cost per Web Site |
$300
|
$1,701
|
$9,000
|
| Annual Maintenance Cost per Site |
$800
|
$3,947
|
$21,000
|
| Total Yr 1 Cost per Site |
$1,100
|
$5,649
|
$30,000
|
|
|
|
|
| Total Yr 1 per Large Firm Costs ($000) |
$110
|
$2,824
|
$27,000
|
| Total Yr 1 Large Firm Costs ($M) |
$102
|
$4,237
|
$81,000
|
|
|
|
|
| ‘Cost’ of Unfound Documents |
|
|
|
| No. of Unknown Documents per Firm |
5,750
|
80,500
|
820,800
|
| Total Number of Large Firm Unknown Docs |
5,347,500
|
120,750,000
|
2,462,400,000
|
|
|
|
|
| Total Cost per Web Site |
$6,900
|
$23,915
|
$350,310
|
| Cost of Unknown Docs per Firm ($000) |
$690
|
$11,958
|
$315,279
|
| Total Cost of Large Firm Unknown Docs ($M) |
$642
|
$17,937
|
$945,837
|
|
|
|
|
| Summary |
|
|
|
| Total Cost per Firm ($000) |
$800
|
$14,782
|
$342,279
|
| Total Cost all Large Firms ($M) |
$744
|
$22,173
|
$1,026,837
|
|
|
|
|
| Development as % of Total Costs |
14%
|
19%
|
8%
|
| Unfound Documents as % of Total Costs |
86%
|
81%
|
92%
|
Table 13. Development and Unfound Document ‘Costs’ for Large Firms due to Web Sprawl
Table 13 consolidates previous information to estimate what the ‘costs’ of Web sprawl might be to larger firms (analogous to the Fortune 1000). The table presents Low, Medium and High estimates for number of Web sites per firm, known and unknown documents in each, and associated costs for initial site development and first-year maintenance plus the value of unfound information. The Medium category uses the average values from previous tables. The Low and High values bracket these amounts based on distribution of known values and expert judgment.
The table indicates as a mid-range estimate that an individual Web site for a large enterprise may cost about $6,000 to set-up and maintain in the first year and represents $24,000 in opportunity costs due to unknown or unfound documents. For the average large enterprise across all Web sites, these costs may be $4.2 million and $12.0 million, respectively. Across all large firms, total costs due to Web sprawl may be on the order of $22 billion.
While site development and maintenance costs are not trivial, exceeding $4 billion for all large firms (which can also be significantly reduced – see previous section), the major cost impact comes from the inability to find or federate the information that is available. Unfound documents represent well in excess of 80% of the costs associated with Web sprawl.
The Web sprawl situation is analogous to other major technology shifts. For example, in the early 1980s, IT grappled mightily with the proliferation of personal computers. Centralized control was impossible in that circumstance because individuals and departments recognized the productivity benefits to be gained by PCs. Only when enterprise-capable vendors of networking technology, such as Novell, were able to offer integration solutions was the corporation able to control and fully exploit the PC’s technology potential.
The proliferation of internal enterprise Web sites is responding to similar drivers: innovation, customer service, or superior methods of product or solutions delivery. Ambitious mid-level managers will continue to exploit these advantages by “cowboy” additions of more corporate Web sites, and that is likely to the good for most enterprises. Gaining control and fully realizing the value of this Web site proliferation – while not stymieing innovation – will likely require enabling technology analogous to the networking of PCs.
IV. OPPORTUNITIES AND THREATS
The previous analysis has focused on more-or-less direct costs and drivers. These impacts are huge and deserve proper consideration. But there are other implications from the inability to access and manage relevant document information. These implications fall into the categories of lost opportunities, liabilities, or non-compliance. These implications often far outweigh the direct costs in their bottom-line impacts. This section presents only a few of these many opportunities.
‘Costs’ and Opportunity Costs of Winning Proposals
Competitive proposals are an important revenue factor to hundreds of thousands of businesses. Indeed, contracts and grants from federal, state and local governments accounted for 12.1% of GDP in 2002; the amount competitively awarded equaled about 5.6% of GDP.[78] Reducing the fully-burdened costs of producing responses to competitive procurements and improving the rate of successfully obtaining them can be a huge competitive advantage to business.
Significant proportions of commercial projects and programs are likewise awarded through competitive proposals and bids. However, literature references to these are limited, and the remainder of this section relies on federal sector statistics as a proxy for the overall category.
Though the federal government is making strides in providing central clearinghouses to opportunities – and is also doing much in moving to uniform application standards and electronic application submissions – these efforts are still in their nascent stages and similar efforts at the state and local level are severely lagging. As a result, the magnitude of the proposal opportunity is perhaps largely unknown to many businesses. This lack of appreciation and attention to the cost- and success-drivers behind winning proposals is a real gap in the competitiveness of many individual businesses.
Table 14 on the following page consolidates information from many government sources to quantify the magnitude of this competitively-awarded grant and contract opportunity with governments.
|
Number of Awards
|
Amount ($000)
|
|
| Federal Government |
|
|
|
| Total Grants |
1,335,813
|
$441,037,633
|
[79] [80] |
| Total Contract Procurements |
1,155,096
|
$327,413,076
|
|
|
|
|
|
| Competitively-awarded Grants |
336,091
|
$99,234,657
|
[81] |
| Competitively-awarded Procurements |
909,087
|
$231,878,136
|
[82] |
|
|
|
|
| Total Competitive Opportunities |
1,245,179
|
$331,112,793
|
|
|
|
|
|
| Ave Competitive Opportunity |
|
$266
|
[83] |
|
|
|
|
| State & Local Government |
|
|
[84] [85] |
| Total Grants |
757,199
|
$190,000,000
|
|
| Total Contract Procurements |
1,439,031
|
$310,000,000
|
|
|
|
|
|
| Competitively-awarded Grants |
190,512
|
$42,750,512
|
[86] |
| Competitively-awarded Procurements |
1,132,551
|
$219,545,972
|
|
|
|
|
|
| Total Competitive Opportunities |
1,323,063
|
$262,296,485
|
|
|
|
|
|
| Ave Competitive Opportunity |
|
$198
|
|
|
|
|
|
| Total (no B-to-B) |
|
|
|
| Competitively-awarded Grants |
526,603
|
$141,985,169
|
|
| Competitively-awarded Procurements |
2,041,638
|
$451,424,108
|
|
|
|
|
|
| Total Competitive Opportunities |
2,568,241
|
$593,409,277
|
|
|
|
|
|
| Ave Competitive Opportunity |
|
$231
|
|
Table 14. Federal, State & Local Contract and Grant Opportunities, 2002
This analysis suggests there are nearly $600 billion available each year for competitively awarded grants and procurements from all levels of government within the U.S.; about 60% from the federal sector. The average competitive award is about $270 K for grants; about $220 K for contract procurements.
Aside from construction firms (which are excluded in this and prior analyses), there are on the order of 92,500 federal contract-seeking firms today.[87] In 2003, the top 200 federal contracting firms accounted for nearly $190 billion in contract outlays.[88] While it is unclear what proportion of these commitments were competitive (81% of total federal commitments) or based on all contract procurements (57% of total federal commitments), it is clear that more than 90,000 firms are competing via a classic power curve for a minor portion of available federal revenues. This power curve is shown in Figure 3 below for the 200 largest federal contractors, which obtain a proportionately high percentage of all contract dollars.
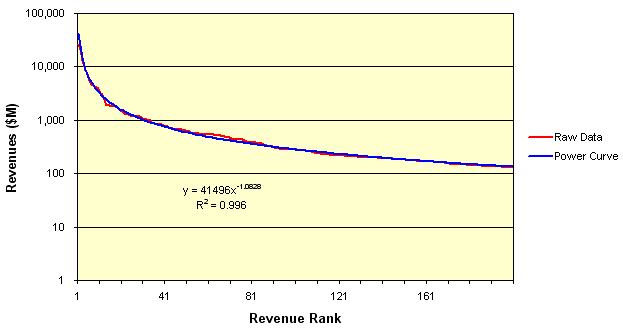
Figure 3. Power Curve Distribution of Top 200 Federal Contractors by Revenue, 2002
The combination of these factors enables an estimate of the bottom-line proposal impacts by firm. This information is shown in the table below:
|
Number
|
Amount ($000)
|
|
| Total Competitive Awards |
|
|
|
|
| Federal |
1,245,179
|
$331,112,793
|
[89] |
| State & Local |
1,323,063
|
$262,296,485
|
|
| Number of Competing Firms |
120,250
|
|
|
[90] |
| Number of Winning Firms |
90,805
|
|
|
|
| Number of Winning Proposals |
2,326,485
|
|
|
|
| Number of Submitted Proposals |
11,211,974
|
|
|
|
|
|
|
|
|
| Direct Proposal Preparation Costs |
|
|
|
|
| Winning Proposal Preparation |
|
$5,021,357
|
[91] |
| Losing Proposals Preparation |
|
$16,939,516
|
|
| TOTAL Proposal Preparation |
|
$21,960,873
|
|
|
|
|
|
|
|
Low
|
Med
|
High
|
|
| Improvement in RFP Development |
7.5%
|
15.0%
|
35.0%
|
[92] |
|
|
|
|
|
| Proposal Preparation |
|
|
|
|
| Benefits – Individual Submitters ($000) |
$14
|
$27
|
$64
|
|
| Benefits – All Submitters ($000) |
$1,647,065
|
$3,294,131
|
$7,686,305
|
|
|
|
|
|
|
| Proposal Success Benefits |
|
|
|
|
| Increase in Number of Winning Submissions |
6,810
|
13,621
|
31,782
|
[93] |
| Increase in Number of Winning Firms |
1,406
|
2,812
|
6,562
|
[94] |
| Benefits – Individual Submitters ($000) |
$1,235
|
$1,235
|
$1,235
|
|
| Benefits – All Submitters ($000) |
$1,737,101
|
$3,474,203
|
$8,106,473
|
|
|
|
|
|
|
| Benefits – All Submitters/All Aspects |
$3,384,167
|
$6,768,334
|
$15,792,778
|
|
Table 15. Combined Preparation Costs and Opportunity Costs for Proposals
Across all entities, the annual cost of preparing proposals to competitive solicitations from government agencies at all levels is on the order of $22 billion, $5 billion for winning firms and $17 billion for losing firms. Better access to missing information and better information – assuming no change in the underlying ideas or proposal-writing skills – suggests that proposal response costs could be reduced by more than $3 billion annually. Another $3 billion annually is available for better winning of competitive proposals. Individual benefits to firms that respond to competitive solicitations is on average $1.25 million per competing firm.[95]
The more significant benefit to individual firms from improved access to “missing” information and better information is increasing the likelihood of winning a competitive award. Firms that embrace these practices are estimated to obtain a $1.2 million annual benefit. Given that many firms that have previously been losing awards have relatively low annual revenues, the percent impact on the bottom line can be quite striking due to improved proposal preparation information.
‘Costs’ of Regulation and Regulatory Non-compliance
A December 2001 small business poll by the National Federation of Independent Business (NFIB) gauged the impacts of the regulatory workload on firms. When asked “is government regulation a very serious, somewhat serious, not too serious, or not at all serious problem for your business,” nearly half, or 43.6 percent, answered “very serious” or “somewhat serious.” The respondents indicated the most serious regulatory problems were at the federal level (49 %), state level (35 %) or local level (13%) of government. The biggest single regulatory problem cited was extra paperwork, followed by difficulty understanding how to comply with regulations and dollars spent doing so.[96] A later December 2003 NFIB survey indicates that the average cost per hour of complying with paperwork requirements was $48.72.[97]
|
Type of Regulation
|
All Firms
|
<20 Employees
|
20-499 Employees
|
500+ Employees
|
| All Federal Regulations |
$5,107
|
$7,544
|
$4,671
|
$4,827
|
|
|
|
|
|
| Environmental |
$1,312
|
$3,600
|
$1,269
|
$776
|
| Economic |
$2,234
|
$1,748
|
$1,782
|
$2,688
|
| Workplace |
$843
|
$897
|
$944
|
$755
|
| Tax Compliance |
$719
|
$1,300
|
$676
|
$608
|
Table 16. Per Employee Costs of Federal Regulation by Firm Size, 2002
According to a 2001 report, “The Impact of Regulatory Costs on Small Firms” by W. Mark Crain and Thomas D. Hopkins, the total costs of Federal regulations were estimated to be $843 billion in 2000, or 8 percent of the U. S. Gross Domestic Product. Of these costs, $497 billion fell on business and $346 billion fell on consumers or other governments. Here are how those impacts are estimated on a per employee basis across a range of firm sizes:[98]
As of September 30, 2002, federal agencies estimated there were about 8.2 billion “burden hours” of paperwork government-wide. Almost 95 percent of those 8.2 billion hours were being collected primarily for the purpose of regulatory compliance. [99]
|
Burden Hrs (million)
|
Labor Costs ($M)
|
| Total Government |
8,223.17
|
$318,237
|
| Total Gov (excl. Treasury) |
1,472.74
|
$56,995
|
|
|
|
| Treasury |
6,750.43
|
$261,242
|
| Transportation |
244.73
|
$9,471
|
| HHS |
224.83
|
$8,701
|
| Labor |
189.22
|
$7,323
|
| EPA |
140.47
|
$5,436
|
| Defense |
92.36
|
$3,574
|
| Agriculture |
88.59
|
$3,428
|
| Justice |
46.60
|
$1,803
|
| Education |
38.44
|
$1,488
|
| State |
29.23
|
$1,131
|
| HUD |
21.93
|
$849
|
| Commerce |
11.65
|
$451
|
| Interior |
7.66
|
$296
|
| Energy |
3.76
|
$146
|
|
|
|
| SEC |
136.58
|
$5,286
|
| FTC |
69.66
|
$2,696
|
| FCC |
26.80
|
$1,037
|
| SSA |
24.89
|
$963
|
| FAR (contracts) |
24.49
|
$948
|
| FCIC |
9.87
|
$382
|
| NRC |
8.34
|
$323
|
| FEMA |
7.77
|
$301
|
| Veterans Administration |
7.31
|
$283
|
| NASA |
5.95
|
$230
|
| NSF |
4.46
|
$173
|
| FERC |
4.38
|
$170
|
| SBA |
2.77
|
$107
|
Table 17. Federal Government Paperwork Burdens, 2002[100]
A December 2003 NFIB survey indicates that the average cost per hour of complying with paperwork requirements was $48.72.[101] If these costs are substituted, the total cost burden in the table above would be about $400 billion, $71 billion of which excludes Treasury and the IRS.
Despite legislation requiring federal paperwork reduction and embracing of e-government initiatives, paperwork burdens continue to increase. Total burden hours in 2002, for example, increased 600 million hours, or about 4 percent, from the previous year. The Code of Federal Regulations (CFR) continues to expand despite efforts to curtail further growth. The CFR grew from 71,000 pages in 1975 to 135,000 pages in 1998. Annually, there are more than 4,000 regulatory changes introduced by the federal government. The federal government now has over 8,000 separate information collection requests authorized by OMB.[102]
|
Federal Source
|
Fines ($ 000)
|
|
| Internal Revenue Service |
$4,119,622
|
[103]
|
| Corporate Income |
$1,120,531
|
|
| Employment Taxes |
$2,691,021
|
|
| Excise Taxes |
$200,585
|
|
| Other Taxes |
$107,486
|
|
|
|
[104] |
| Agriculture |
$2,000
|
|
| Economic Stabilization |
$9,000
|
|
| Labor & Immigration |
$72,000
|
|
| Commerce & Customs (excl SEC) |
$22,000
|
|
| SEC |
$101,000
|
[105]
|
| Narcotics & Alcohol |
$2,000
|
|
| Mine Safety |
$18,000
|
|
| Environmental Protection |
$212,000
|
[106]
|
| Miscellaneous |
$1,000
|
|
| Other |
$448,000
|
|
|
|
|
| TOTAL |
$5,006,622
|
|
Table 18. Federal Fines and Penalties to Corporations, 2002
Another source of costs to enterprises are civil penalties and fines for non-compliance with existing regulations, as shown in the table above for 2002 by agency. A total of $5 billion annually is expended by U.S. businesses for civil penalties due to non-compliance with federal regulation, $1 billion of which is due to non-tax purposes.
However, these estimates may undercount actual fines and penalties levied by the federal government due to the accounting basis of the OMB source. For example, the Department of Labor (DOL) collected fines and penalties totaling $175 million from employers in fiscal year 2002 for Fair Labor Standards Act (FLSA) violations.[107] According to a 2002 report, since 1990, 43 of the government’s top contractors paid approximately $3.4 billion in fines/penalties, restitution, and settlements.[108] And, according to another report, the corporations liable to the top 100 False Claims Act paid more than $12 billion since 1986.[109] Since there is no central clearinghouse for this information, with both individual agency general counsels and the Department of Justice responsible for actual collections, the figures in Table 18 should be interpreted as estimates.
Table 19 on the next page consolidates the information in Table 16 to Table 18 to estimate the overall regulatory and paperwork burdens on U.S. businesses, plus estimates of the benefits to be gained from better document access and use.
‘Cost’ of an Unauthorized Posted Document
Unauthorized information disclosures derive mainly from within an organization. The ease of electronic record duplication and dissemination – particularly through postings on enterprise Web sites – increases a firm’s vulnerability to this problem. Records mutate and propagate in poorly controlled environments. On average, unauthorized disclosure of confidential information costs Fortune 1000 companies about $15 million per company per year.[110]
A few privacy laws demonstrate the potential liabilities associated with disclosure of confidential information due to inadvertent mistakes or disgruntled employees. As one example, the Health Insurance Portability and Accountability Act (HIPAA) of 1996 sets security standards protecting the confidentiality and integrity of “individually identifiable health information,” past, present or future. Failure to comply with any of the electronic data, security, or privacy standards can result in civil monetary penalties up to $25,000 per standard per year. Violation of the privacy regulations for commercial or malicious purposes can result in criminal penalties of $50,000 to $250,000 in fines and one to ten years of imprisonment.[111]
|
|
Amount ($000)
|
|
| Total Federal Paperwork Burden (non-tax) |
$56,995,038
|
[112] |
| Total Federal Other Regulatory Burden |
$331,791,551
|
[113] |
| Total Federal Fines and Penalties |
$5,006,622
|
[114] |
|
|
|
|
|
| Total State and Local Paperwork Burden (non-tax) |
$32,059,709
|
[115] |
| Total State and Local Other Regulatory Burden |
$186,632,748
|
|
| Total State and Local Fines and Penalties |
$2,816,225
|
|
|
|
|
|
|
|
Low
|
Med
|
High
|
|
| Improvements Due to Better Information |
7.5%
|
15.0%
|
35.0%
|
|
|
|
|
|
|
| Paperwork Burdens (non-tax) |
|
|
|
|
| Benefits per Large Firm |
$1,957
|
$3,915
|
$9,134
|
[116] |
| Benefits – All Firms |
$6,679,106
|
$13,358,212
|
$31,169,161
|
|
|
|
|
|
|
| Other Regulatory Burdens |
|
|
|
|
| Benefits per Large Firm |
$11,394
|
$22,788
|
$53,172
|
|
| Benefits – All Firms |
$38,881,822
|
$77,763,645
|
$181,448,505
|
|
|
|
|
|
|
| Reductions in Fines and Penalties |
|
|
|
|
| Benefits per Large Firm |
$4,212
|
$8,424
|
$19,655
|
|
| Benefits – All Firms |
$14,372,953
|
$28,745,905
|
$67,073,779
|
|
|
|
|
|
|
| TOTAL – All Regulatory Burdens |
|
|
|
|
| Benefits per Large Firm |
$17,563
|
$35,126
|
$81,962
|
|
| Benefits – All Firms |
$59,933,881
|
$119,867,762
|
$279,691,445
|
|
Table 19. Regulatory Burden and Benefits to Firms from Improved Information
As another example, the Gramm-Leach-Bliley Act (GLBA) of 1999 mandates the financial industry to create guidelines for the safeguarding of customer information. GLBA includes severe civil and criminal penalties for non-compliance, with civil penalties up to $100,000 for each violation and key officers may be fined up to $10,000 per violation. Violation of the GLBA can also carry hefty sanctions, including termination of FDIC insurance and fines of up to $1,000,000 for an individual or one percent of the total assets of the financial institution.[117]
Other major areas of unauthorized disclosure liability occur in national security, identity theft, and commerce, tax and Social Security information. Indeed, virtually every state and federal agency related to a company’s business has policies and fines regarding unauthorized disclosures. Monitoring these requirements is thus an imperative for enterprise management to prevent exposure to fines and loss of reputation.
On a less-quantifiable basis there are also risks about the clarity of the enterprise message to customers, suppliers and partners. Unmanaged Web sprawl is a critical hole for enterprises to ensure compliance with privacy and confidentiality regulations, and to promote clarity of message and accuracy to stakeholders.
V. CONCLUSIONS
Prior to the analysis in this white paper, the state of understanding about the value of document assets had been abysmal. While still preliminary and subject to much improvement, this study has nonetheless found:
- The value of documents – in their creation, access and use – can indeed be measured
- The information contained within U.S. enterprise documents represents about a third of gross domestic product, or an amount of about $3.3 trillion annually
- Some 25% of all of these expenditures lend themselves to actionable improvements
- There are perhaps on the order of 10 billion documents created annually in the U.S.
- Corporate data doubles every six to eight months; 85% of this data is contained in documents
- Ninety to 97 percent of enterprises cannot estimate how much they spend on producing documents each year
- Document creation is about 2-3 times more important – from an embedded cost standpoint – than document handling
- It costs, on average, $350 to create a ‘typical’ document
- The total potential benefit from practical improvements in document access and use to the U.S economy is on the order of $800 billion annually, or about 8% of GDP
- For the 1,000 largest U.S. firms, benefits from these improvements can approach nearly $250 million annually per firm
- About three-quarters of these benefits arise from not re-creating the intellectual capital already invested in prior document creation
- Another 25% of the benefits are due to reduced regulatory non-compliance or paperwork, or better competitiveness in obtaining solicited contracts and grants
- $33 billion is wasted each year in re-finding previously found Web documents
- Paperwork and regulatory improvements due to documents can save U.S. enterprises $120 billion each year
- Lack of document access due to Web sprawl costs U.S. enterprises $22 billion each year
- $8 billion in annual benefits is available due to document improvements for competitive governmental grant and contract solicitations
- These figures likely severely underestimate the benefits to enterprises from improved competitiveness, a factor not analyzed in this study
- Documents are now at the point where structured data was at 15 years ago at the nascent emergence of the data warehousing market.
As noted throughout, there is a considerable need for additional research and data on document creation, use, costs and benefits. Additional technical endnotes are provided in the PDF version of the full paper.
[1] All sources and assumptions are fully documented in footnotes in the main body of this white paper; general assumptions used in multiple tables are provided in the Technical Endnotes.
[2] As quoted by Armando Garcia, vice president of content management at IBM; see http://www.contentworld.com/conference/conthur.html
[3] Delphi Group, “Taxonomy & Content Classification Market Milestone Report,” Delphi Group White Paper, 2002. See http://delphigroup.com.
[4] Based on the 1999 to 2001 estimate changes in reference 34, Table 2-6.
[5] As initially published in Inc Magazine in 1993. Reference to this document may be found at: http://www.contingencyplanning.com/PastIssues/marapr2001/6.asp
[6] J. Snowdon, Documents – The Lifeblood of Your Business?, October 2003, 12 pp. The white paper may be found at: http://www.mdy.com/News&Events/Newsletter/IDCDocMgmt.pdf
[7] Xerox Global Services, Documents – An Opportunity for Cost Control and Business Transformation, 28 pp., 2003. The findings may be found at: http://www.sap.com/solutions/srm/pdf/CCS_Xerox.pdf
[8] A.T. Kearney, Network Publishing: Creating Value Through Digital Content, A.T. Kearney White Paper, April 2001, 32 pp. See http://www.adobe.com/aboutadobe/pressroom/pressmaterials/networkpublishing/pdfs/netpubwh.pdf.
[9] S.A. Mohrman and D.L. Finegold, Strategies for the Knowledge Economy: From Rhetoric to Reality, 2000, University of Southern California study as supported by Korn/Ferry International, January 2000, 43 pp. See http://www.marshall.usc.edu/ceo/Books/pdf/knowledge_economy.pdf.
[10] C. Moore, TheContent Integration Imperative, Forrester Research Trends Report, March 26, 2004, 14 pp.
[11] D. Vesset, Worldwide Business Intelligence Forecast and Anal ysis, 2003-2007, International Data Corporation, June 2003, 18 pp. See http://www.dwway.com/file/20030708085453_IDC_WW-BIFORECASTANDANALYSIS2003-07_JUN03.pdf.
[12] M. Stonebraker and J. Hellerstein, “Content Integration for E-Business,” in ACM SIGMOD Proceedings, Santa Barbara, CA, pp. 552-560, May 2001.
[13] P. Lyman and H. Varian, “How Much Information, 2003,” retrieved from http://www.sims.berkeley.edu/how-much-info-2003 on December 1, 2003.
[14] U.S. Department of Commerce, Digital Economy 2003, Economic Statistics Administration, U.S. Dept. of Commerce, Washington, D.C., April 2004, 155 pp. See http://www.esa.doc.gov/DigitalEconomy2003.cfm.
[15] U.S. Department of Labor, “Occupation Employment and Wages, 2002,” Bureau of Labor Statistics. See http://www.bls.gov/news.release/archives/ocwage_11192003.pdf.
[16] U.S. Census Bureau, “Statistics of U.S. Businesses 2001.” See http://www.census.gov/epcd/susb/2001/us/US–.htm.
[17] Total office documents counts were obtained on a page basis from reference 13, which used a value of 2% for what documents deserve to be archived. This formed the ‘lo’ case, with the high case using a 5% estimate (lower still than the ENST 10% estimated cited in reference 13). Total pages were converted to numbers of documents on an average 8 pp per document basis; see Technical Endnotes for further discussion.
[18] See Technical Endnotes for the derivation of knowledge worker estimates.
[19] See Technical Endnotes for the derivation of content worker estimates.
[20] Citation sources and assumptions for this analysis are presented in the BrightPlanet white paper, “A Cure to IT Indigestion: Deep Content Federation,” BrightPlanet Corporation White Paper, June 2004, 31 pp.
[21] The “bottom up” cases are built from the number of assumed knowledge workers in Table 3. The “low” and “high” variants are based on a 5% archival value or 350 annual documents created per worker, respectively, applied to worker staff costs associated with document creation. The “Coopers & Lybrand” case is a strict updating of that study to 2002. The other two “C&L” cases use the updated per document costs from the C&L study; the first variant uses the annual documents created from the UC Berkeley study without archiving; the second variant uses the average of the “low” and “high” document numbers. See further Technical Endnotes for other key assumptions.
[22] The individual values in Table 5 range from about $140 to $740 per document, with the update of the Coopers & Lybrand study being about $270. Separate Delphi analysis by BrightPlanet has shown median values of about $550 per document.
[23] See http:// www.eds.com/services_offerings/ibill_openbill_b2b.shtml
[24] See http://www.hsh.com/cfee-sample.html.
[25] See http://www.atp.nist.gov/eao/applicants/section9.htm.
[26] As initially published in Inc Magazine in 1993. Reference to this document may be found at: http://www.contingencyplanning.com/PastIssues/marapr2001/6.asp
[27] Xerox Global Services, Documents – An Opportunity for Cost Control and Business Transformation, 28 pp., 2003. The findings may be found at: http://www.sap.com/solutions/srm/pdf/CCS_Xerox.pdf and J. Snowdon, Documents – The Lifeblood of Your Business?, October 2003, 12 pp. The white paper may be found at: http://www.mdy.com/News&Events/Newsletter/IDCDocMgmt.pdf
[28] Optika Corporation. See http://www.optika.com/ROI/calculator/ROI_roiresults.cfm.
[29] Cap Ventures information, as cited in ZyLAB Technologies B.V., “Know the Cost of Filing Your Paper Documents,” Zylab White Paper, 2001. See http://www.zylab.com/downloads/whitepapers/PDF/21%20-%20Know%20the%20cost%20of%20filing%20your%20paper%20documents.pdf.
[30] ALL Associates Group, Inc., EDAM Sector Summary, April 2003, 2 pp.
[31] ALL Associates Group, 2002 EDAM Metrics for Major U.S. Companies.
[32] By the second Q 2004, this amount was $11.6 trillion. U.S. Federal Reserve Board, Flow of Funds Accounts for the United States, Sept. 16, 2004. See http://www.federalreserve.gov/releases/Z1/current/accessible/f6.htm.
[33] The bases for this table have the following assumptions: 1) the three cases for document handling are based on 5%, 10% and 15% of total enterprise revenues, per the earlier section; 2) the three cases for document creation are based on the ‘C&L Bottom-Up’, ‘Bottom-up – High,’ and ‘Coopers & Lybrand’ items for the Low, Medium, and High columns, respectively, in Table 5; and 3) the document misfiling case draws on the same basis but using the total document estimates and misfiled percentages of 5%, 7.5% and 9% consistent with the previous discussion section. See further the Technical Endnotes.
[34] P. Lyman and H. Varian, “How Much Information, 2003,” retrieved from http://www.sims.berkeley.edu/how-much-info-2003 on December 1, 2003.
[35] Cap Ventures information, as cited in ZyLAB Technologies B.V., “Know the Cost of Filing Your Paper Documents,” Zylab White Paper, 2001. See http://www.zylab.com/downloads/whitepapers/PDF/21%20-%20Know%20the%20cost%20of%20filing%20your%20paper%20documents.pdf.
[36] As reported in http://www.hoovers.com/company/archive/detail/0,2049,7_2322,00.html.
[37] See http://www.veronissuhler.com/businfo/segment.html, August 2, 2000.
[38] See http://www.outsellinc.com/docs/pr_release/pr20000602_01.htm, June 2, 2000.
[39] See http://www.outsellinc.com/docs/pr_release/pr20000629_01.htm.
[40] M.K. Bergman, “The Deep Web: Surfacing Hidden Value,” BrightPlanet Corporation White Paper, June 2000. The most recent version of the study was published by the University of Michigan’s Journal of Electronic Publishing in July 2001. See http://www.press.umich.edu/jep/07-01/bergman.html.
[41] This analysis assumes there were 1 million documents on the Web as of mid-1994.
[42] See, for example, C. Sherman and G. Price, The Invisible Web, Information Today, Inc., Medford, NJ, 2001, 439 pp., and P. Pedley, The Invisible Web: Searching the Hidden Parts of the Internet, Aslib-IMI, London, 2001, 138pp.
[43] iProspect Corporation, iProspect Search Engine User Attitudes, April/May 2004, 28 pp. See http://www.iprospect.com/premiumPDFs/iProspectSurveyComplete.pdf.
[44] As reported at http://www.nua.ie/surveys/index.cgi?f=VS&art_id=905358569&rel=true.
[45] Delphi Group, “Taxonomy & Content Classification Market Milestone Report,” Delphi Group White Paper, 2002. See http://delphigroup.com.
[46] C. Sherman and S. Feldman, “The High Cost of Not Finding Information,” International Data Corporation Report #29127, 11 pp., April 2003.
[47] M.E.D. Koenig, “Time Saved – a Misleading Justification for KM,” KMWorld Magazine, Vol 11, Issue 5, May 2002. See http://www.kmworld.com/publications/magazine/index.cfm.
[48] G. Xu, A. Cockburn and B. McKenzie, Lost on the Web: An Introduction to Web Navigation Research, http://www.cosc.canterbury.ac.nzq/ACMchapterq/NZCSPGq/papers.
[49] A. Cockburn and B. McKenzie, What Do Web Users Do? An Empirical Analysis of Web Use, 2000. See http://citeseer.ist.psu.edu/cockburn00what.html.
[50] Tenth edition of GVU’s (graphics, visualization and usability} WWW User Survey, May 14, 1999. See http://www.gvu.gatech.edu/user_surveys/survey-1998-10/tenthreport.html.
[51] C. Alvarado, J. Teevan, M. S. Ackerman and D.Karger, “Surviving the Information Explosion: How People Find Their Electronic Information,” AI Memo 2003-06, April 2003, 11 pp.., Massachusetts Institute of Technology, Computer Science and Artificial Intelligence Laboratory. See ftp://publications.ai.mit.edu/ai-publications/2003/AIM-2003-006.pdf.
[52] W. Jones, H. Bruce and S. Dumais, “Keeping Found Things Found on the Web,” See http://washington.edu/KFTF_Web.pdf.
[53] J. Teevan, “How People Re-find Information When the Web Changes,” AI Memo 2004-014, June 2004, 10 pp., Massachusetts Institute of Technology, Computer Science and Artificial Intelligence Laboratory. See ftp://publications.ai.mit.edu/ai-publications/2004/AIM-2004-012.pdf.
[54] Library of Congress, “Preserving Our Digital Heritage: Plan for the National Digital Information Infrastructure and Preservation Program”, a Report to Congress by the U.S. Library of Congress, 2002, 66 pp. See http://www.digitalpreservation.gov/ndiipp/.
[55] Consistent with Table 8; this analysis also assumes the 25% search time commitment by employee and previous values from earlier tables.
[56] All subsequent references to ‘Large’ firms is based on the last column in Table 2, namely the 930 U.S. firms with more than 10,000 employees.
[57] Delphi Group, “Taxonomy & Content Classification Market Milestone Report,” Delphi Group White Paper, 2002. See http://delphigroup.com.
[58] S. Stearns, “Realize the Value Locked in Your Content Silos Without Breaking the Bank: Automated Classification Tools to Improve Information Discovery,” Inmagic White Paper, version 1.0, 2004. 10 pp. See http://www.inmagic.com.
[59] P. Sonderegger, “Weave Search into the Browsing Experience,” ForresterQuick Take, Forrester Research, Inc., Feb. 18, 2004. 2 pp.
[60] P. Russom, “An Eye for the Needle,” Intelligent Enterprise, January 14, 2002. See http://www.iemagazine.com/020114/502feat2_1.
[61] This average was estimated by interpolating figures shown on Figure 8 in reference 68.
[62] This average was estimated by interpolating figures shown on the p.14 figure in Plumtree Corporation, “The Corporate Portal Market in 2002,” Plumtree Corp. White Paper, 27 pp. See http://www.plumtree.com/pdf/Corporate_Portal_Survey_White_Paper_February2002.pdf.
[63] The ‘low’ case represents the archival value in the middle bars with the addition that 30% of internal documents generated in the current year have a value to be shared for one year; the ‘high’ case represents the related archival value in the middle bars but with 40% of documents generated in that year having a value to be shared for one year.
[64] Analysis based on reference 68, with interpolations from Figure 16.
[65] M. Corcoran, “When Worlds Collide: Who Really Owns the Content,” AIIM Conference, New York, NY, March 10, 2004. See http://show.aiimexpo.com/convdata/aiim2003/brochures/64CorcoranMary.pdf.
[66] C. Phillips, “Stemming the Software Spending Spree,” Optimize Magazine, April 2002, Issue 6. See http://www.optimizemag.com/article/showArticle.jhtml?articleId=17700698&pgno=1.
[67] C. Moore, “The Content Integration Imperative,” Forrester Research, Inc., March 26, 2004, 14 pp.
[68] Plumtree Corporation, “The Corporate Portal Market in 2003,” Plumtree Corp. White Paper, 30 pp. See http://www.plumtree.com/portalmarket2003/default.asp.
[69] BEA Corporation, “Enterprise Portal Rationalization,” BEA Technical White Paper, 23 pp., 2004. See http://www.bea.com/content/news_events/white_papers/BEA_epr_wp.pdf.
[70] A. Aneja, C.Rowan and B. Brooksby, “Corporate Portal Framework for Transforming Content Chaos on Intranets,” Intel Technology Journal Q1, 2000. See http://developer.intel.com/technology/itj/q12000/pdf/portal.pdf.
[71] J. Smeaton, “IBM’s Own Intranet: Saving Big Blue Millions,” Intranet Journal, Sept. 25, 2002. See http://www.intranetjournal.com/articles/200209/ij_09_25_02a.html.
[72] See http://www.wookieweb.com/Intranet/.
[73] D. Voth, “Why Enterprise Portals are the Next Big Thing,” LTI Magazine, October 1, 2002. See http://www.ltimagazine.com/ltimagazine/article/articleDetail.jsp?id=36877.
[74] A. Nyberg, “Is Everybody Happy?” CFO Magazine, November 01, 2002. See http://www.cfo.com/article/1%2C5309%2C8062%2C00.html.
[75] See http://www.proudfoot-plc.com/pdf_20004-USPR1002Avayaweb.asp.
[76] Wall Street Journal, May 4, 2004, p. B1.
[77] pers. comm.., Jonathon Houk, Director of DHS IIAP Program, November 2003.
[78] These figures are based on Table 12 and the GDP figures from reference 32. Note, the analysis in this section also ignores business-to-business opportunities, which are also likely significant.
[79] Total grant and procurement amounts are derived from the U.S. Census Bureau, Consolidated Federal Funds Report (CFFR). See http://harvester.census.gov/cffr/asp/Reports.asp.
[80] The number of awards and an analysis of which line items are competitively awarded was derived from the U.S. Census Bureau, Federal Assistance Award Data System (FAADS). See http://www.census.gov/govs/faads/021sumus.htm.
[81] Specific categories of grants were analyzed based on the U.S. General Services Administration’s Catalog of Federal Domestic Assistance (CFDA) definitions to determine degree of competitiveness; see http://12.46.245.173/cfda/cfda.html. Figures from the U.S. Department of Health and Human Services, Grant.gov Clearinghouse (see http://www.grants.gov/) suggest that $350 billion in federal grants is available, but many of the specific grant opportunities are geared to state governments or individuals. That is why the figures shown indicate only $100 billion in competitive opportunities available directly to enterprises.
[82] U.S. General Services Administration, Federal Procurement Data System – NG (FY 2003 data); see http://www.fpdc.gov/fpdc/FPR2003a.pdf and http://www.fpdc.gov/fpdc/FPR2003c.pdf. These sources are also the reference for the number of actions or successful awards. Due to discrepancies, these amounts were adjusted to conform with the totals in reference 79.
[83] Average competitive opportunities are derived by dividing the total award amount by category by the number of awards for that category.
[84] See http://www.gcswin.com/opportunities/opp2.htm. This is the only summary reference for state and local information found. Splits between grants and contract procurements were adjusted based on the assumption that contract amounts differed at the non-federal level. Thus, while the split for grant-contract procurements in the federal sector is about 58%-42% in the federal sector, it is assumed to be 38%-62% at the state and local level.
[85] There may also be some double counting of state amounts due to transfers from the federal government. For example, in 2002, $360,534 million in direct transfers was made to states and localities from the federal government. U.S. Census Bureau, State and Local Government Finances by Level of Government and by State: 2001 – 02. See http://www.census.gov/govs/estimate/0200ussl_1.html.
[86] BrightPlanet assumes that individual grant and contract awards are 80% of the amount shown at the federal level.
[87] To be listed requires a minimum of $10,000 in federal contracts; see http://clinton2.nara.gov/WH/EOP/OP/html/aa/aa06.html.
[88] See http://www.govexec.com/features/0804-15/0804-15s1s1.htm.
[89] This header information is drawn from Table 12.
[90] Number of competing firms is increased from the federal contractor baseline by a factor of 1.30 to account for new state and local government contractors.
[91] Winning and losing proposal preparation costs are based on the empirical percentages from NIST (see reference 93), namely 0.85% and 0.59%, respectively, as a percent of total award amounts.
[92] The ‘Low’ basis for improvements is based on the finding of missing information discussed in a previous section; the ‘High” basis reflects the difference between lowest quartile and highest quartile efforts spent on successful proposal preparation (see reference 93). The ‘Med’ basis is an intermediate value between these two.
[93] The increase in winning submissions is calculated based on numbers of winning proposals times the RFP improvement factor. In fact, because all things being equal the pool of contract dollars does not change, this amount merely represents a shift of winning awards from existing winners to new winners. In other words, total contracts amounts are a zero-sum game with proposal improvements by previous losers taken from the pool of previous winners.
[94] The analysis in Figure 2 indicates there is a power curve distribution of awards. The number of new winning proposals was applied to this curve to estimate the actual number of new firms winning awards; see Figure 2 for the power-curve fitting equation.
[95] Of course, better probabilities of winning competitive solicitations are a zero-sum game. New winners displace old winners. The real advantage in this arena is to individual firms that better succeed at securing the existing pool of competitive funds. The benefits to individual companies can be the difference between profitability, indeed survival.
[96] NFIB, Coping with Regulation, NFIB National Small Business Poll, Vol. 1, Issue 5. See http://www.nfib.com/object/3105105.html.
[97] NFIB, Paperwork and Record-keeping, NFIB National Small Business Poll, Vol. 3, Issue 5. See http://www.nfib.com/object/4131277.html.
[98] W. M. Crain & T. D. Hopkins, “The Impact of Regulatory Costs on Small Firms”, Report to the Small Business Administration, RFP No. SBAHQ-00-R-0027 (2001). The report’s 2000 year basis was updated to 2002 based on a 4% annual inflation factor.
[99] U.S. General Accounting Office, Paperwork Reduction Act: Record Increase in Agencies’ Burden Estimates, testimony of V. S. Rezendes, before the Subcommittee on Energy, Policy, Natural Resources and Regulatory Affairs, Committee on Government Reform, House of Representatives, April 11, 2003. See http://www.reform.house.gov/UploadedFiles/Testimony_GAO_Revised.pdf.
[100] Office of Management and Budget, Managing Information Collection and Dissemination, Fiscal Year 2003, 198 pp. (Table A1). See http://www.whitehouse.gov/omb/inforeg/2003_info_coll_dism.pdf.
[101] NFIB, Paperwork and Record-keeping, NFIB National Small Business Poll, Vol. 3, Issue 5. See http://www.nfib.com/object/4131277.html.
[102]U.S. Small Business Administration, Final Report of the Small Business Paperwork Relief Task Force, June 27, 2003, 64 pp. See http://www.sbaonline.sba.gov/advo/laws/final_paperwork03.pdf.
[103] IRS, Civil Penalties Assessed and Abated, by Type of Penalty and Type of Tax (Table 26), September 20, 2002. See http://www.irs.gov/pub/irs-soi/02db26cp.xls.
[104] Except as footnoted, the figures below are drawn from the OMB Public Budget Tables. Civil penalties for crime victims have been excluded from these figures. See http://www.whitehouse.gov/omb/budget/fy2005/db.html.
[105] Obtained orders in SEC judicial and administrative proceedings requiring securities law violators to disgorge illegal profits of approximately $1.293 billion. Civil penalties ordered in SEC proceedings totaled approximately $101 million. See SEC http://www.sec.gov/pdf/annrep02/ar02enforce.pdf.
[106] T. L. Sansonetti, U.S. Department of Justice, testimony before the House Committee on the Judiciary, Subcommittee on Commercial and Administrative Law, March 9, 2004. See http://www.house.gov/judiciary/sansonetti030904.htm.
[107]Argy, Wiltse & Robinson, Business Insights, Summer 2003, 4 pp. See http://www.awr.com/news_let/Argy%20Summer%202003.pdf
[108] Project on Government Oversight, Federal Contractor Misconduct: Failures of the Suspension and Debarment System, revised May 10, 2002. See http://www.pogo.org/p/contracts/co-020505-contractors.html.
[109]Corporate Crime Reporter, Top 100 False Claims Act Settlements, December 30, 2003, 64 pp. See http://www.corporatecrimereporter.com/fraudrep.pdf.
[110] According to Alchemia Corporation testimony citing a Price Waterhouse Coopers study, FDA Hearing, Jan. 17, 2002. See http://www.fda.gov/ohrms/dockets/dockets/ 00d1538/00d-1538_mm00023_01_vol7.doc.
[111] For example, see http://www.medschool.ucsf.edu/curriculum/clinical/guide/section2/confidentiality.asp.
[112] From Table 17.
[113] From Table 16 after adjusting by total number of employees for all firms as shown on Table 2, and removal of total burdens as shown in Table 17.
[114] From Table 18.
[115] All ‘State and Local’ items are based on the ratio of state and local budgets in relation to the federal budget, excluding direct federal transfers, and applied to those factors for the federal sector. This ratio is 0.563. See http://www.gpoaccess.gov/usbudget/fy01/guide01.html.
[116] All ‘Large Firm’ estimates are based on the ratio of large firm documents to total firm documents; see Table 2.
[117] For example, see http://www.nfr.com/why/mandates.php#gramm