Posted:November 1, 2005

The first recorded mentions of “semi-structured data” occurred in two academic papers from Quass et al.[1] and Tresch et al.[2] in 1995. However, the real popularization of the term “semi-strucutred data” occurred through the seminal 1997 papers from Abiteboul, “Querying semi-structured data,” [3] and Buneman, “Semistructured data.” [4] Of course, semi-structured data had existed well before this time, only it had not been named as such.

What is Semi-structured Data?

Peter Wood, a professor of computer science at Birkbeck College at the University of London, provides succinct definitions of the “structure” of various types of data:[5]

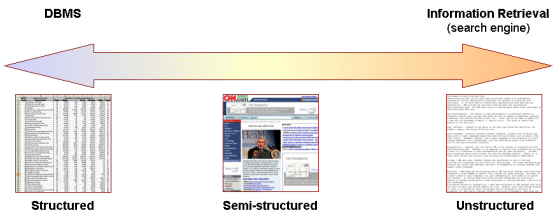
  • Structured Data — or classes. Entities in the same group have the same descriptions (or attributes), while descriptions for all entities in a group (or schema): a) have the same defined format; b) have a predefined length; c) are all present; and d) follow the same order. Structured data are what is normally associated with conventional databases such as relational transactional ones where information is organized into rows and columns within tables. Spreadsheets are another example. Nearly all understood database management systems (DBMS) are designed for structural data
  • Unstructured Data — in this form, data can be of any type and do not necessarily follow any format or sequence, do not follow any rules, are not predictable, and can generally be described as “free form.” Examples of unstructured data include text, images, video or sound (the latter two also known as “streaming media”). Generally, “search engines” are used for retrieval of unstructured data via querying on keywords or tokens that are indexed at time of the data ingest, and
  • Semi-structured Data — the idea of semi-structured data predates XML but not HTML (with the actual genesis better associated with SGML, see below). Semi-structured data are intermediate between the two forms above wherein “tags” or “structure” are associated or embedded within unstructured data. Semi-structured data are organized in semantic entities, similar entities are grouped together, entities in the same group may not have same attributes, the order of attributes is not necessarily important, not all attributes may be required, and the size or type of same attributes in a group may differ. To be organized and searched, semi-structured data should be provided electronically from database systems, file systems (e.g., bibliographic data, Web data) or via data exchange formats (e.g., EDI, scientific data, XML).

Unlike structured or unstructured data, there is no accepted database engine specific to semi-structured data. Some systems attempt to use relational DBMS approaches from the structured end of the spectrum; other systems attempt to add some structure to standard unstructured search engines. (This topic is discussed in a later section.)
Semi-structured data models are sometimes called “self-describing” (or schema-less). These data models are often represented as labelled graphs, or sometimes labelled trees with the data stored at the leaves. The schema information is contained in the edge labels of the graph. Semi-structured representations also lend themselves well to data exchange or the integration of heterogeneous data sources.

A nice description by David Loshin[6] on Simple Semi-structured Data notes that structured data can be easily modeled, organized, formed and formatted in ways that are easy for us to manipulate and manage. In contrast, though we are all familiar with the unstructured text in documents, such as articles, slide presentations or the message components of emails, its lack of structure prevents the advantages of structured data management. Loshin goes on to describe the intermediate nature of semi-structured data:

There [are] sets of data in which there is some implicit structure that is generally followed, but not enough of a regular structure to “qualify” for the kinds of management and automation usually applied to structured data. We are bombarded by semi-structured data on a daily basis, both in technical and non-technical environments. For example, web pages follow certain typical forms, and content embedded within HTML often have some degree of metadata within the tags. This automatically implies certain details about the data being presented. A non-technical example would be traffic signs posted along highways. While different areas use their own local protocols, you will probably figure out which exit is yours after reviewing a few highway signs.

This is what makes semi-structured data interesting–while there is no strict formatting rule, there is enough regularity that some interesting information can be extracted. Often, the interesting knowledge involves entity identification and entity relationships. For example, consider this piece of semi-structured text (adapted from a real example):

John A. Smith of Salem, MA died Friday at Deaconess Medical Center in Boston after a bout with cancer. He was 67.

Born in Revere, he was raised and educated in Salem, MA. He was a member of St. Mary’s Church in Salem, MA, and is survived by his wife, Jane N., and two children, John A., Jr., and Lily C., both of Winchester, MA.

A memorial service will be held at 10:00 AM at St. Mary’s Church in Salem.

This death notice contains a great deal of information–names of people, names of places, relationships between people, affiliations between people and places, affiliations between people and organizations and timing of events related to those people. Realize that not only is this death notice much like others from the same newspaper, but that it is reasonably similar to death notices in any newspaper in the US.

Note in Loshin’s example that the “structure” added to the unstructured text (shown in yellow; my emphasis) to make this “semi-structured” data arises from adding informational attributes that further elaborate or describe the document. These attributes can be automatically found using “entity extraction” tools or similar information extraction (IE) techniques, or manually identified. [7] These attributes can be assigned to pre-defined record types for manipulation separate from a full-text seach of the document text. Generally, when such attributes are added to the core unstructured data it is done through “metatags” that a parser can structurally recognize, such as by using the common open and close angle brackets. For example:

<author=John Smith>

In semi-structured HTML, the tags that provide the semi-structure serve a different purpose in terms of either formatting instructions to a browser or providing reference links to internal anchors or external documents or pages. Note that HTML also uses the open and close angle brackets as the convention to convey the structural information in the document.

The Birth of the Semi-structured Data Construct

One could argue that the emergence of the “semi-structured data” construct arose from the confluence of a number of factors:

  • The emergence of the Web
  • The desire for extremely flexible formats for data exchange between disparate databases (and therefore useful for data federation)
  • The usefulness of expressing structured data in a semi-structured way for the purposes of browsing
  • The growth of certain scientific databases, especially in biology (esp., ACeDB), where annotations, attribute extensibility resulting from new discoveries, or a broader mix of structural and text data was desired.[8]

These issues first arose and received serious computer science study in the late 1970s and early 1980s. In the early years of trying to find standards and conventions for representing semi-structured data (though not yet called that), the major emphasis was on data transfer protocols.

In the financial realm, one proposed standard was electronic data interchange (EDI). In science, there were literally tens of exchange forms proposed with varying degrees of acceptance, notably abstract syntax notation (ASN.1), TeX (a typesetting system created by Donald Knuth and its variants such as LaTeX), hierarchical data format (HDF), CDF (common data format), and the like, as well as commercial formats such as Postscript, PDF (portable document format), RTF (rich text format), and the like.

One of these proposed standards was the “standard generalized markup language” (SGML), first published in 1986. SGML was flexible enough to represent either formatting or data exchange. However, with its flexibility came complexity. Only when two simpler forms arose, namely HTML (HyperText Markup Language) for describing Web pages and XML (eXtensible Markup Language) for data exchange, did variants of the SGML form emerge as widely used common standards.[9]

The XML standard was first published by the W3C in February 1998, rather late in this history and after the semi-structured data term had achieved some impact.[10] Dan Suciu was the first to publish on the linkage of XML to semi-structured data in 1998,[11] a reference that remains worth reading to this day.

In addition, the OEM (Object Exchange Model) has become the de facto model for semi-structured data. OEM is a graph-based, self-describing object instance model. It was originally introduced for the Tsimmis data integration project,[12] and provides the intellectual basis for object representation in a graph structure with objects either being atomic or complex.

How the attribute “metadata” is described and associated has itself been the attention of much standards work. Truly hundreds of description standards have been proposed from specific instances in medical terminology such as MESH to law to physics to engineering and to cross-discipline proposed standards such as the Dublin core. (Google these for a myriad of references.)

Challenges in Semi-structured Data

Semi-structured data, as for all other data structures, needs to be represented, transferred, stored, manipulated or analyzed, all possibly at scale and with efficiency. It is often easy to confuse data representation from data use and manipulation. XML provides an excellent starting basis for representing semi-structured data. But XML says little or nothing about these other challenges in semi-structured data use:

  • Data heterogeneity — the subject of data heterogeneity in federated systems is extremely complex, and involves such areas as unit or semantic mismatches, grouping mismatches, non-uniform overlap of sets, etc. “Glad” may be the same as”happy” but it may also be expressed in metric v. English units. This area is complex and subject to its own topic
  • Type inference — related to the above is the data type requiring resolution, for example, numeric data being written as text
  • Query language — actually, besides transfer standards, probably more attention has been given to query languages supporting semi-structured data, such as XQuery, than other topics. Remember, however, that a query language is the outgrowth of a data storage framework, not a determinant, and this distinction seems to be frequently lost in the semi-structured literature
  • Extensibility — inherent with the link to XML is the concept of extensibility with semi-structured data. However, it is important to realize that extensibility as used to date is in reference to data representation and not data processing. Further, data processing should occur without the need for database updates. Indeed, it is these later points that provide a key rationale for BrightPlanet‘s XSDM system
  • Storage — XML and other transfer formats are universally in text or Unicode, excellent for transferability but shitty for data storage. How these representations actually get stored (and searched, see next) is fundamental to scalable systems that support these standards
  • Retrieval — many have and are proposing native XML retrieval systems, and others have attempted to clone RDBMSs or search (text) engines for these purposes. Retrieval is closely linked to query language, but, more fundamentally, also needs to be speedy and scalable. As long as semi-structured retrieval mechanisms are poor-cousin add-ons to systems optimized for either structured or unstructured data, they will be poor performers
  • Distributed evaluation (scalability) — most semi-structured or XML engines work OK at the scale of small and limited numbers of files. However, once these systems attempt to scale to an enterprise level (of perhaps tens of thousands to millions of documents) or, god forbid, Internet scales of billions of documents, they choke and die. Again, data exchange does not equal efficient data processing. The latter deserves specific attention in its own right, which has been lacking to date
  • Order — consider a semi-structured data file transferred in the standard way (which is necessary) as text. Each transferred file will contain a number of fields and specifications. What is the efficient order of processing this file? Can efficiencienes be gained through a “structural” view of its semi-structure? Realize that any transition from text to binary (necessary for engine purposes, see above), also requires “smart” transformation and load (TL) approaches. There is virtually NO discussion of this problem in the semi-strucutred data literature
  • Standards — while XML and its variants provide standard transfer protocols, the use of back-end engines for efficient semi-structured data processing also requires prescribed transfer standards in order to gain those efficiencies. Because the engines are still totally lacking, this next level of prescribed formats is lacking as well.

Generally, most academic, open source, or other attention to these problems has been at the superficial level of resolving schema or definitions or units. Totally lacking in the entire thrust for a semi-structured data paradigm has been the creation of adequate processing engines for effiicient and scalable storage and retrieval of semi-structured data. [13]

You know, it is very strange. Tremendous effort goes into data representations like XML, but when it comes to positing or designing engines for manipulating that data the approach is to clone kludgy workarounds on to existing relational DBMSs or text search engines. Neither meet the test.

Thus, as the semantic Web and its association to semi-structured data looks forward, two impediments stand like gatekeepers blocking forward progress: 1) efficient processing engines and 2) scalable systems and architectures.


[1] D. Quass, A. Rajaraman, Y. Sagiv, J. Ullman and J. Widom, “Querying Semistructured Heterogeneous Information,” presented at Deductive and Object-Oriented Databases (DOOD ’95), LNCS, No. 1013, pp. 319-344, Springer, 1995.

[2] M. Tresch, N. Palmer, and A. Luniewski, “Type Classification of Semi-structured Data,” in Proceedings of the International Conference on Very Large Data Bases (VLDB), 1995.

[3] Serge Abiteboul, “Querying Semi-structured data,” in International Conference on Data Base Theory (ICDT), pp. 1 – 18, Delphi, Greece, 1997. See http://dbpubs.stanford.edu:8090/pub/1996-19.

[4] Peter Buneman, “Semistructured Data,” in ACM Symposium on Principles of Database Systems (PODS), pp. 117 – 121, Tucson, Arizona, May 1997. See http://db.cis.upenn.edu/DL/97/Tutorial-Peter/tutorial-semi-pods.ps.gz

[5] Peter Wood, School of Computer Science and Information Systems, Birkbeck College, the University of London. See http://www.dcs.bbk.ac.uk/~ptw/teaching/ssd/toc.html.

[6] David Loshin, “Simple Semi-structured Data,” Business Intelligence Network, October 17, 2005. See http://www.b-eye-network.com/view/1761.

[7] This example is actually quite complex and demonstrates the challenges facing “entity extraction” software. Extracted entities most often relate to the nouns or “things” within a document. Note also, for example, how many of the entities involve internal “co-referencing,” or the relation of subjects such as “he” to times such as “10 a.m” to specific dates. A good entity extraction engine helps resolve these so-called “within document co-references.”

[8] Peter Buneman, “Semistructured Data,” in ACM Symposium on Principles of Database Systems (PODS), pp. 117 – 121, Tucson, Arizona, May 1997. See http://db.cis.upenn.edu/DL/97/Tutorial-Peter/tutorial-semi-pods.ps.gz

[9] A common distinction is to call HTML “human readable” while XML is “machine readable” data.

[10] W3C, XML Development History. See http://www.w3.org/XML/hist2002.

[11] Dan Suciu, “Semistructured Data and XML,” in International Conference on Foundations of Data Organization (FODO), Kobe, Japan, November 1998. See PDF option from http://citeseer.ist.psu.edu/suciu98semistructured.html.

[12] Y. Papakonstantinou, H. Garcia-Molina and J. Widom, “Object Exchange Across Heterogeneous Information Sources,” in IEEE International Conference on Data Engineering, pp. 251-260, March 1995.

[13] Matteo Magnani and Danilo Montesi, “A Unified Approach to Structured, Semistructured and Unstructured Data,” Technical Report UBLCS-2004-9, Department of Computer Science, University of Bologna, 29 pp., May 29, 2004. See http://www.cs.unibo.it/pub/TR/UBLCS/2004/2004-09.pdf.

NOTE: This posting is part of an occasional series looking at a new category that I and BrightPlanet are terming the eXtensible Semi-structured Data Model (XSDM). Topics in this series cover all information related to extensible data models and engines applicable to documents, metadata, attributes, semi-structured data, or the processing, storing and indexing of XML, RDF, OWL, or SKOS data. A major white paper will be produced at the conclusion of the series. Stay tuned!
Posted:October 31, 2005

As an entrepreneur who has now dealt with VCs for close to ten years, one phrase repeated more times than I care to recount has been, "The time for paying tuition is over; it’s time to show revenue multiples."

The first times I heard this mantra it went without question.  I know, as does everyone involved in a start-up, that revenue is goodness and messing around ("paying tuition") is badness.  I think, in general, that shareholder and investor impatience for a quick return on capital is a proper and laudable expectation.  If you’re in the big leagues, you need to either hit, field or pitch, or better still, multiples of these.

But neither technology nor markets are predictable.  Another statement frequently heard is "if you need to educate the market, your business model is wrong."  Another is "show me the way to $20 million annual revenues within the next XX months."

I ain’t a kid anymore, and I appreciate the demands for performance and results.  Starting up a business and spending other people’s money (not to mention my own and my family’s) to achieve returns is not for the fainthearted.  Fair enough.  And understood.

But the real disconnect is how to balance multiple factors.   I think I appreciate the pressures on VCs for returns.  I also understand their win some/lose some mentality.  (Actually, what I don’t understand is the acceptance of the high percentage rates of individual investment failures; something is not systematic and wrong here; but I digress.) 

But what I truly don’t understand is the application of mantras vs. a careful balance of positive and negative factors for a venture.  Excellent and innovative technology is often in search of proper applications and markets.  Excellent and innovative technology is often not initially mature for market acceptance.  Excellent and innovative technology is often misdirected by its founders until engagement with the market and customers helps refine features and product expressions.  Excellent and innovative technology is sometimes tasty cookie dough that  needs more time in the oven.

Presumably, as has been the case for my own ventures, the basis for investment has been excellent and innovative technology.  We all know the standard recipe of market-technolgy-management that sprinkles every high-tech VC Web site.  But, of course, and honestly and realistically, not all of these factors are in play when venture financing is sought.  And, let’s face it, if they were in play, there would not be an interest by the entrepeneurs to dilute their ownership.

I suppose, then, that all players in a venture-financed start-up are subject to various forms of willful or self-deception.  Entrrepreneurs and VCs alike believe they have all the answers.  And, of course, neither do. 

What I have come to learn is that it is the market that has the answers, and sometimes that takes time to figure out.  Good diligence at the front end is warranted — after all, there needs to be the basis of some excellent foundations — as are mechanisms for "feeding out the line" of venture dollars and claw back and other egregious ways to lay off risk because bad choices are often made.  But what should not be acceptable, should not be perpetuated, is the expectation as to WHEN these returns will be achieved. 

There is simply no avoiding that new, innovative and sexy technology may not be able to be precisely timed.  Rather than railing about not paying more tuiition, every VC that has done diligence and made a venture commitment should be cheering for more learning and more refinement.  Begin with good partial foundations (be they technology-management-market) and applaud the tuition of learning and refinement.  In the end, we never graduate; we hopefully progress to life-long learning.

"Longing gazes and worn out phrases won’t get you where you want to go.  No!"   –  Mamas and Papas   

Next up:  "The Myth of Superman"  

Posted by AI3's author, Mike Bergman Posted on October 31, 2005 at 9:46 pm in Software and Venture Capital | Comments (0)
The URI link reference to this post is: https://www.mkbergman.com/155/no-more-tuition/
The URI to trackback this post is: https://www.mkbergman.com/155/no-more-tuition/trackback/

Naveen Balani has recently published a good intro primer on the Semantic Web through IBM’s Developer Works entitled, "The Future of the Web is Semantic".  Highly recommended.

Also, a recent paper on information retrieval and the semantic web was selected as the best paper in the 2005 ICSS mini-track on The Semantic Web: The Goal of Web Intelligence.  The paper, by Tim Finin, James Mayfield, Clay Fink, Anupam Joshi, and R. Scott Cost, Information Retrieval and the Semantic Web, Proceedings of the 38th International Conference on System Sciences, January 2005, is also available as a PDF download. I recommend this to anyone interested in the application of Semantic Web concepts to traditional Internet search engines.

Posted by AI3's author, Mike Bergman Posted on October 31, 2005 at 11:34 am in Adaptive Information, Searching, Semantic Web | Comments (0)
The URI link reference to this post is: https://www.mkbergman.com/152/two-recent-semantic-web-papers/
The URI to trackback this post is: https://www.mkbergman.com/152/two-recent-semantic-web-papers/trackback/
Posted:October 30, 2005

There was an interesting exchange between Martin Nisenholtz and Tim O’Reilly at a recent Union Square Session on the topic of peer production and open data architectures.  Martin was questioning how prominent “winners” like Wikipedia may prejudice our view of the likelihood of Web winners in general.  Here’s the exchange:

NISENHOLTZ:  I sort of call it the lottery syndrome.  There was a Powerball lottery yesterday.  Tons of people entered it.  We know that someone won in Oregon . . . we also know that the chances of winning  were one in 164 million . . . .I guess what I’m struggling with is how we measure the number of peer production efforts that get started versus Wikipedia, which has become the poster child, the lottery, the one in 164 million actually works.  Now it may not be one in 164 million.  It may be one in 10.  It may be one in 50, but I think that groups of people like [prominent Web thinkers] tend to create the lottery winner and hold the lottery winner up as the norm.

O’REILLY:    Look at Source Forge, there’s something like 104,000 projects on Source Forge.  You can actually do a long tail distribution and figure out how many of them — but … I would guess that one in like … 154 million are probably out of those 100,000 projects, there are probably, you know, at least 5,000 who have made significant reputation gains as a result of their work.  Maybe more. But, again, somebody should go out and measure that.

It just so happens that I had recently done that SourceForge project analysis in June, which is mostly still relevant since only a few months old.  That info is reproduced below.

Strong Growth for Open Source Projects

In open source there are some big visibility winners and lots of activity. (For an excellent overview of the leading and successful open source projects, see Uhlman.[1]) The numbers of these projects have grown rapidly, increasing by about 30% to 100,000 projects in the past year alone. However, like virtually everything else, the relative importance or use of open source projects tend to follow standard power curve distributions.

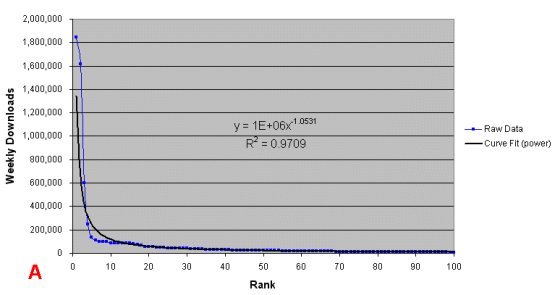
The truly influential projects only number in the hundreds, as figures from SourceForge, a clearinghouse solely devoted to open source projects, indicate. There is a high degree of fluctuation, but as of May 2005 there were on the order of perhaps 13 million total software code downloads per week from SourceForge (A). Though SourceForge statistics indicate it has some 100,000 open source projects within its database, in fact fewer than half of those have any software downloads, only 1.7% of the listed projects are deemed mature, and only about 15,000 projects are classified as production or stable.[2]

But power curve distributions indicate even a much smaller number of projects account for most activity. For example, the top 100 SourceForge projects account for 60% of total downloads, with the top two, Azureus and eMule, alone accounting for about one-quarter of all downloads. Indeed to even achieve 1000 downloads per day, a SourceForge open source project must be within the top 150 projects, or just 0.2% of those active or 0.1% of total projects listed.[3]

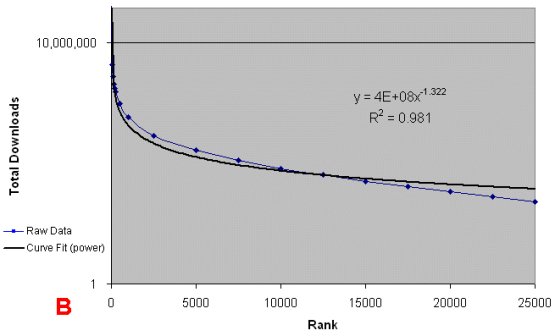
Similar trends are shown for cumulative downloads. Since its formation in 2000, software code downloads from SourceForge have totalled nearly one billion (actually, an estimated 892 million as of May 2005) (B, logarithmic scale). Again, however, a relatively small number of projects has dominated.

For example, 60% of all downloads throughout the history of SourceForge have occurred for the 100 most active projects. It can be reasonably defended that the number of open source projects with sufficient reach and use to warrant commercial attention probably total fewer than 1,000.

Open Source is Not the Same as Linux

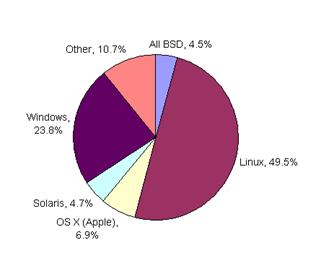
Some observers, such as for example the Open reSource site[4], tends to equate open source with the Linux operating system and all aspects around it. While it is true that Linux was one of the first groundbreakers in open source and is the operating system with the largest open source market share, that is still only about one-half of all projects according to SourceForge statistics:

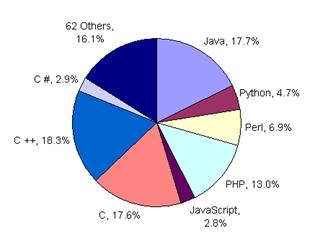
Windows projects have been growing in importance, along with Apple. In terms of programming languages, various flavors of C, followed by the ‘P’ languages (PHP, Python, Perl) and Java are the most popular. Note, however, that many projects combine languages, such as C for core engines and PHP for interfaces. Also note that many projects have multiple implementations, such as support for both Linux and Windows installations and perhaps PHP and Perl versions. Finally, the popularity of the Linux – Apache – MySQL and P languages have earned many open source projects the LAMP moniker. When replaced by Windows this is sometimes known as WAMP or with Java its known as LAMJ:

Because of the diversity of users, larger and more successful projects tend to have multiple versions.

Few Active Developers Support Most Projects

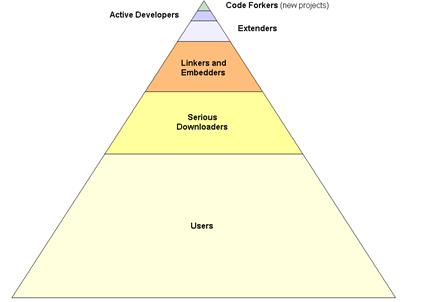
Despite source code being open and developers invited for participation, most mature open source projects in fact receive little actual development attention and effort from outsiders. Entities that touch and get involved in an open source project tend to form a pyramid of types. This pyramid, and the types of entities that become involved from the foundation upward, can be characterized as:

  • Users — by far the largest category, users simply want use of no cost software or some comfort the code base is available (as below)
  • Serious downloaders — there is an active class of Internet users that spend considerable time downloading application, game or other software, installing it, and then removing it and moving on. The motivations for this large software grazing class varies. Some are interested in seeing new software ideas, installation methods, user interfaces and the like; some are consultants or pundits that want to be current with new systems and trends; others simply are the Internet equivalent of serial mall shoppers. Whatever the motivation, this class of users acts to inflate download statistics, and sometimes may be key influence makers or spreaders of word-of-mouth, but are unlikely to establish a lasting relationship with a project
  • Linkers and embedders — these users are at the serious end of the actual user group and have clear ideas about needed functionality and will expend considerable effort to link or embed a promising new open source project into their current working environment. This level of engagement requires a considerable amount of effort and acts to increase the switching costs of later moving away from the project
  • Extenders — these individuals create the wrappers and other APIs for establishing interoperabiltiy and use between existing components in currently disparate environments (Apache, IIS or Tomcat; Windows, Linux; PHP,  PERL or Java, etc.) or critically bring the project to other languages, human or programmatic. They are perhaps the most attractive group of users from a project influence standpoint. This category is the major source of external innovation
  • Active developers — this is the standard assumed class of developers who actually sign-up and do major work on the initial project. But a surprising few number of developers participate in this category, and this category, like the next one, is close to non-existant for open source projects that follow the license choice model as proposed for BrightPlanet below
  • Code forkers — some mature and larger visibility open source projects (not including the license choice model) may witness a major breakaway in development. This can occur because of some differences in philosopy (some of the Linux variants), loss of interest by the original sponsor (HTMLarea WYSIWG editor, for example), or branching to different programming languages (many of the CMS variants). Code forking can be a source of innovation and use expansion, but also can serve to kill the original branch and leave existing users at a dead end.

Most effort around successful open source projects is geared to extending the environments or interoperability of those projects with others — both laudable objectives — rather than fundamental base code progression.

Mature Projects are Stable, Scalable, Reliable and Functional

David Wheeler has maintained the major summary site for open source performance statistics and studies for many years.[5] In compiling literally hundreds of independent studies, Wheeler observes that “OSS/FS [open source software/free software] . . . is often the most reliable software, and in many cases has the best performance. OSS/FS scales, both in problem size and project size. OSS/FS software often has far better security, perhaps due to the possibility of worldwide review. Total cost of ownership for OSS/FS is often far less than proprietary software, especially as the number of platforms increases.” However, while obviously an advocate, Wheeler is also careful to not claim these advantages across the board or for all open source projects.

Indeed, most of the studies cited by Wheeler obviously deal with that small subset of mature open source projects, and often surrounding Linux and not necessarily some of the new open source projects moving towards applications.

Probably the key point is that even though there may be ideological differences between advocates for or against open source, there is nothing inherent in open-source software that would make it inferior or superior to proprietary software. Like all other measures, the quality of the team behind an initiative is the driving force for quality as opposed to open or closed code.


[1] D. Uhlman, Open Source Business Applications, see http://www.socallinuxexpo.org/presentations/david_uhlman_scale3x.pdf

[2] I’d like to thank Matt Asay for pointing the way to digging into SourceForge statistics. It is further worth recommending his “Open Source and the Commodity Urge: Distruptive Models for a Distruptive Development Process,” November 8, 2004, 17 pp., which may be found at: http://www.open-bar.org/docs/matt_asay_open_source_chapter_11-2004.pdf

[3] Of course, downloads may occur at other sites than SourceForge and there are other proxies for project importance or activity, such as pageviews, the measure that SourceForge itself uses. However, as the largest compilation point on the Web for open source projects, the SourceForge data are nonethless indicative of these power curve distributions.

[4] See Open reSource http://sterneco.editme.com/

[5] D.A. Wheeler, Why Open Source Software / Free Software (OSS/FS, FLOSS, or FOSS)? Look at the Numbers!, versuion updated May 5, 2005. See http://www.dwheeler.com/oss_fs_why.html. The paper also has useful summaries of market informatin and other open source statistics.

Posted by AI3's author, Mike Bergman Posted on October 30, 2005 at 12:49 pm in Open Source, Software and Venture Capital | Comments (0)
The URI link reference to this post is: https://www.mkbergman.com/148/the-lottery-syndrome-and-recent-open-source-statistics/
The URI to trackback this post is: https://www.mkbergman.com/148/the-lottery-syndrome-and-recent-open-source-statistics/trackback/
Posted:October 26, 2005

As noted by the Nobel laureate economist Herbert Simon more than 30 years ago:[1]

What information consumes is rather obvious: it consumes the attention of its recipients. Hence a wealth of information creates a poverty of attention, and a need to allocate that attention efficiently among the overabundance of sources that might consume it. . . . The only factor becoming scarce in a world of abundance is human attention.

Spiraling document growth combined with the universal migration of digital information to the Internet has been come to be known by the terms “infoglut” or “information overload.” The issue, of course, is not simply massive growth, but more importantly the ability to find the right information at the right time to make actionable decisions.

Document assets are poorly utilized at all levels and within all departments within enterprises. The magnitude of this problem was first documented in a BrightPlanet white paper titled, Untapped Assets: The $3 Trillion Value of U.S. Enterprise Documents. An open question in that paper was why nearly $800 billion per year in the U.S. alone is wasted and available for improvements, but enterprise expenditures to address this problem remain comparatively small and with flat growth in comparison to the rate of document production.

Earlier parts in this series addressed whether the root causes of this poor use were due to the nature of private v. public information or due to managerial and other barriers to collaboration. This part investigates whether high software and technology costs matched with poor performance is a root cause.

The Document Situation Within U.S. Enterprises

Document creation represents about $3.3 billion in annual costs to U.S. enterprises, or about 30% of gross national product, $800 billion of which can be reclaimed through better access, recall and use of these intellectual assets. For the largest U.S. firms, annual benefits from better document use average about $250 million per firm.[2]

Perhaps at least 10% of an enterprise’s information changes on a monthly basis.[3] A 2003 UC Berkeley study on “How Much Information?” estimated that more than 4 billion pages of internal office documents are generated annually in the U.S. with archival value. The percentage of unstructured (document) data to the total amount of enterprise data is estimated at 85% and growing.[4] Year-on-year office document growth rates are on the order of 22%.[2]

Based on these averages, a ‘typical’ document may cost on the order of $380 each to create.[5] Standard practice suggests it may cost on average $25 to $40 per document simply for filing.[6] Indeed, labor costs can account for up to 30% of total document handling costs.[7] Of course, a “document” can vary widely in size, complexity and time to create, and therefore its individual cost and value will vary widely. An invoice generated from an automated accounting system could be a single page and be produced automatically in the thousands; proposals for very large contracts can take tens or thousands or even millions of dollars to create.

According to a Coopers & Lybrand study in 1993 90 percent of corporate memory exists on paper.[8] A Xerox Corporation study commissioned in 2003 and conducted by IDC surveyed 1000 of the largest European companies and had similar findings:[9],[10]

  • On average 45% of an executive’s time was spent dealing with documents
  • 82% believe that documents were crucial to the successful operation of their organizations
  • A further 70% claimed that poor document processes could impact the operational agility of their organizations
  • While 83%, 78% and 76% consider faxes, email and electronic files as documents, respectively, only 48% and 46% categorize web pages and multimedia content as such.

Significantly, 90 to 97 percent of the corporate respondents to the Coopers & Lybrand and Xerox studies, respectively, could not estimate how much they spent on producing documents each year. Almost three quarters of them admit that the information is unavailable or unknown to them.

These statistics apply to the perhaps 20 million knowledge workers within US firms (though other estimates have ranged as high as 40 million).[11], [12] Of this number, perhaps nearly one million have job responsibilities solely devoted to content management. In the largest firms, there are likely 300 employees or more whose sole responsibility is content management.

The High Cost of Searching and Organizing

The average knowledge worker spends 2.3 hrs per day — or about 25% of work time — searching for critical job information, with 60% saying search is a difficult process, made all the more difficult without a logical organization to content.[3] A USC study reported that typically only 32% of employees in knowledge organizations have access to good information about technical developments relevant to their work, and 79% claim they have inadequate information about what their competitors are doing.[13]

According to the Gartner Group, the average enterprise spends from 60 to 70% of its application development budgets creating ways to access disparate data, importantly including documents.[14] IDC estimates that enterprises employing 1,000 knowledge workers may waste well over $6 million per year each in searching for information that does not exist, failing to find information that does, or recreating information that could have been found but was not.[15] As that report stated, “It is simply impossible to create knowledge from information that cannot be found or retrieved.”

Forrester reported in 2002 that 54% of Global 3500 companies relied at that time on homegrown systems to manage content.[16] One vendor cites national averages as indicating that most organizations spend from 5% to 10% of total company revenue on handling documents;[7] Cap Ventures suggests these ranges may be as high as 6% to 15%, with the further observation that 85% of all archived documents never leave the filing cabinet.[6]

An A.T. Kearney study sponsored by Adobe, EDS, Hewlett-Packard, Mayfield and Nokia, published in 2001, estimated that workforce inefficiencies related to content publishing cost organizations globally about $750 billion. The study further estimated that knowledge workers waste between 15% to 25% of their time in non-productive document activities.[17]

Delphi Group’s research points to the lack of organized information as the number one problem in the opinion of business professionals. More than three-quarters of the surveyed corporations indicated that a taxonomy or classification system for documents is imperative or somewhat important to their business strategy; more than one-third of firms that classify documents still use manual techniques.[6]

So, how does an enterprise proceed to place its relevant documents into a hierarchically organized taxonomy or subject tree? The conventional approach taken by most vendors separates the process into two steps. First, each document is inspected and then “metatagged” with relevant words and concepts specific to the enterprise’s view of the world. The actual labels for the tags are developed from an ontology or the eventual taxonomic structure in which the documents will get placed.[18] Then, second, these now-tagged documents are then evaluated on the basis of the tags against the subject tree for conducting the actual placements. But, as noted below, this approach is extremely costly and does not scale.

Web Sprawl: The Proliferation of Corporate Web Sites

Another issue facing enterprises, especially large ones, is the proliferation of Web sites or “Web sprawl.” This proliferation began as soon as the Internet became popular. Here are some anecdotal examples:

  • As early as 1995, DEC (purchased by Compaq and then Hewlett Packard) had 400 internal Web sites and Sun Microsystems had more than 1,000[19]
  • As reported in 2000, Intel had more than 1 million URLs on its intranet with more than 100 new Web sites being introduced each month[20]
  • In 2002, IBM consolidated over 8,000 intranet sites, 680 ‘major’ sites, 11 million Web pages and 5,600 domain names into what it calls the IBM Dynamic Workplaces, or W3 to employees[21]
  • Silicon Graphics’ ‘Silicon Junction’ company-wide portal serves 7,200 employees with 144,000 Web pages consolidated from more than 800 internal Web sites[22]
  • Hewlett-Packard Co., for example, has sliced the number of internal Web sites it runs from 4,700 (1,000 for employee training, 3,000 for HR) to 2,600, and it makes them all accessible from one home, @HP [23],[24]
  • Providence Health Systems recently consolidated more than 200 sites[25]
  • Avaya Corporation is now consolidating more than 800 internal Web sites globally[26]
  • The Wall Street Journal recently reported that AT&T has more than 10 information architects on staff to maintain its 3,600 intranet sets that contain 1.5 million public Web pages[27]
  • The new Department of Homeland Security is faced with the challenge of consolidating more than 3,000 databases inherited from its various constituent agencies.[28]

Corporate IT does not even know the full extent of Web site proliferation, similar to the loss of centralized control when personal PCs entered the enterprise. In that circumstance it took changes in managerial mindsets and new technology such as the PC network by Novell before control could be reasserted. Similar changes will be necessary to corral the issue of Web sprawl.

The Tyranny of Expectations

Vendor hype is one of the causes of misplaced expectations, but also wrong assumptions regarding benefits and costs.

One area where this can occur is in time savings. Vendors and customers often use time savings by knowledge workers as a key rationale for justifying a document initiative. This comes about because many studies over the years have noted that white collar employees spend a consistent 20% to 25% of their time seeking information; the premise is that more effective search will save time and drop these percentages. However, the fact these percentages have held stable over time suggests this is the “satisficing” allocation of time to information search. Thus, while better tools to aid better discovery may lead to finding better information and making better decisions more productively — an intangible and important justification in itself — there may not result a strict time or labor savings from more efficient search.[29]

Another area is lack of awareness about full project costs. According to Charles Phillips of Morgan Stanley, only 30% of the money spent on major software projects goes to the actual purchase of commercially packaged software. Another third goes to internal software development by companies. The remaining 37% goes to third-party consultants.[30]

The Poor Performance of Existing Software

High expectations matched with poor performance is the match in the gas-filled room. Some of the causes of poor document content software performance include:

  • Poor Scalability — according to a market report published by Plumtree in 2003, the average document portal contains about 37,000 documents.[31] This was an increase from a 2002 Plumtree survey that indicated average document counts of 18,000.[32] However, about 60% of respondents to a Delphi Group survey said they had more than 50,000 internal documents in their internal environment (generally the department level). Poor scalability and low coverage of necessary documents is a constant refrain by early enterprise implementers
  • Long Implementation Times — though average time to stand-up a new content installation is about 6 months, there is also a 22% risk that deployment times exceeds that and an 8% risk it takes longer than one year. Furthermore, internal staff necessary for initial stand-up average nearly 14 people (6 of whom are strictly devoted to content development), with the potential for much larger head counts[33]
  • Very High Ongoing Maintenance and Staffing Costs — a significantly limiting factor to adoption is the trend that suggests that ongoing maintenance and staffing costs exceed the initial deployment effort. Based on analysis from BrightPlanet, the table below summarizes set-up, ongoing maintenance and key metrics for today’s conventional approaches versus what BrightPlanet can do.  These staffing estimates are consistent with a survey of 40 installations that found there were on average 14 content development staff managing each enterprise’s content portal.[34] Current practices costing $5 to $11 per document for electronic access are simply unacceptable:

DOCUMENT

INITIAL SET-UP

MAINTENANCE

BASIS

Staff

Mos

$/Doc

Staff

$/Doc

Current Practice

37,000

6.2

5.4

$4.861

6.4

$11.278

BrightPlanet

250,000

1.0

0.8

$0.017

0.3

$0.078

BP Advantage

6.8 x + up

6.2 x

6.7 x

280.4 x

21.4 x

144.6 x

  • Lousy Integration Capabilities — content can not be treated in isolation for the total information needs of the organization
  • High TCO — all of these factors combine into an unacceptable total cost of ownership. High TCO and risk are simply too great to raise the priority of document management sufficiently up within IT priorities, despite the general situational awareness that “infoglut” is costing the firm a ton.

The Result: An Immature Market Space

The lack of standards, confusing terminology, some failed projects, immaturity of the space and the as-yet emergence of a dominant vendor have prevented more widespread adoption of what are clearly needed solutions to pressing business content needs. Vendors and industry analysts alike confuse the market with competing terminology, each trying to carve out a unique “message” in this ill-formed space. Read multiple white papers or inspect multiple vendor Web sites and these difficulties become evident. There are no accepted benchmarks by which to compare performance and cost implications for content management. This limitation is especially acute because, given the confusion in the market, there are no independent sources to turn to for insight and quantitative comparisons.

These issues — in combination with high costs, risks and uncertainty of performance and implementation success — lead to a very immature market at present.

Conclusions

Clearly, the high costs of document management software matched with poor performance and unmet expectations is one of the root causes for the $800 billion annual waste in document use within U.S. enterprises. However, as other parts of this series point out, the overall explanation for this wasteful situation is very complex with other important contributing factors at play.

Document use and management software can be considered to be at a similar point to where structured data was at 15 years ago at the nascent emergence of the data warehousing market. Growth in this software market will require substantial improvements in TCO and scalability, among a general increase in awareness of the magnitude of the problem and available means to solve it.


[1] H.A. Simon, “Designing Organizations for an Information Rich World,” in M. Greenberger (ed.), Computers, Communications, and the Public Interest, pp. 38-52, July 1971, The Johns Hopkins University Press, Balimore, MD. Reprinted in: H.A. Simon, Models of Bounded Rationality and Other Economic Topics, Vol. 2.Collected Papers, The MIT Press, Cambridge, MA, May 1982.

[2] M.K. Bergman, “Untapped Assets: The $3 Trillion Value of U.S. Enterprise Documents,” BrightPlanet Corporation White Paper, December 2004, 37 pp. See http://www.brightplanet.com/technologydocumentvalue.asp.

[3] Delphi Group, “Taxonomy & Content Classification Market Milestone Report,” Delphi Group White Paper, 2002. See http://delphigroup.com.

[4] P. Lyman and H. Varian, “How Much Information, 2003,” retrieved from http://www.sims.berkeley.edu/how-much-info-2003 on December 1, 2003.

[5] M.K. Bergman, “A Cure to IT Indigestion: Deep Content Federation,” BrightPlanet Corporation White Paper, December 2004, 40 pp. See http://www.brightplanet.com/technology/whitepapers.asp

[6] Cap Ventures information, as cited in ZyLAB Technologies B.V., “Know the Cost of Filing Your Paper Documents,” Zylab White Paper, 2001. See http://www.zylab.com/downloads/whitepapers/PDF/21%20-%20Know%20the%20cost%20of%20filing%20your%20paper%20documents.pdf.

[7] Optika Corporation. See http://www.optika.com/ROI/calculator/ROI_roiresults.cfm

[8] As initially published in Inc Magazine in 1993. Reference to this document may be found at: http://www.contingencyplanning.com/PastIssues/marapr2001/6.asp

[9] J. Snowdon, Documents — The Lifeblood of Your Business?, October 2003, 12 pp. The white paper may be found at: http://www.mdy.com/News&Events/Newsletter/IDCDocMgmt.pdf

[10] Xerox Global Services, Documents – An Opportunity for Cost Control and Business Transformation, 28 pp., 2003. The findings may be found at: http://www.sap.com/solutions/srm/pdf/CCS_Xerox.pdf

[11] Nuala Beck, Shifting Gears: Thriving in the New Economy, Harper Collins Publishers, Toronto, 1993.

[12] pers. comm.., Guy Cresse, Aberdeen Group, November 19, 2001.

[13] S.A. Mohrman and D.L. Finegold, Strategies for the Knowledge Economy: From Rhetoric to Reality, 2000, University of Southern California study as supported by Korn/Ferry International, January 2000, 43 pp. See http://www.marshall.usc.edu/ceo/Books/pdf/knowledge_economy.pdf.

[14] Gartner Group, as reported by P. Hallett, Schemalogic Corporation, at the 2003 Enterprise Data Forum, Philadelphia, PA, November 2003. See http://www.wilshireconferences.com/EDF2003/tripreport.htm.

[15] C. Sherman and S. Feldman, “The High Cost of Not Finding Information,” International Data Corporation Report #29127, 11 pp., April 2003.

[16] J.P. Dalton, “Enterprise Content Management Delusions,” Forrester Research Report, June 2002. 12 pp. See http://www.forrester.com/ER/Research/Report/Summary/0,1338,14981,00.html.

[17] A.T. Kearney, Network Publishing: Creating Value Through Digital Content, A.T. Kearney White Paper, April 2001, 32 pp. See http://www.adobe.com/aboutadobe/pressroom/pressmaterials/networkpublishing/pdfs/netpubwh.pdf.

[18] Though most widely used, the concept of “taxonomy” began with Linnaeus whose purpose was to name and place organisms within a hierarchical structure with dichotomous keys (yes, no) deciding each branch. The result is to place every species within a unique taxon including such concepts as family, genus and species. Content subject taxonomies allow multiple choices at each branch and therefore do not have a strict dichotomous structure. “Ontologies” better refer more generally to the nature or “being” of a problem space; they generally consist of a controlled vocabulary of related concepts. Ontologies need not, and often do not, have a hierarchical structure, and are therefore also not strictly accurate. “Subject tree” visually conveys the hierarchical, nested character of these structures, but is less “technical” than other terms.

[19] D. Strom, “Creating Private Intranets: Challenges and Prospects for IS,” an Attachmate White Paper prepared by David Stron, Inc., November 16, 1995. See http://www.strom.com/pubwork/intranetp.html.

[20] A. Aneja, C.Rowan and B. Brooksby, “Corporate Portal Framework for Transforming Content Chaos on Intranets,” Intel Technology Journal Q1, 2000. See http://developer.intel.com/technology/itj/q12000/pdf/portal.pdf.

[21] J. Smeaton, “IBM’s Own Intranet: Saving Big Blue Millions,” Intranet Journal, Sept. 25, 2002. See http://www.intranetjournal.com/articles/200209/ij_09_25_02a.html.

[22] See http://www.wookieweb.com/Intranet/.

[23] D. Voth, “Why Enterprise Portals are the Next Big Thing,” LTI Magazine, October 1, 2002. See http://www.ltimagazine.com/ltimagazine/article/articleDetail.jsp?id=36877.

[24] A. Nyberg, “Is Everybody Happy?” CFO Magazine, November 01, 2002. See http://www.cfo.com/article/1%2C5309%2C8062%2C00.html.

[25] See http://www.cubiccompass.com/downloads/Industry/Healthcare/Providence%20Health%20Systems%20Case%20Study.doc.

[26] See http://www.proudfoot-plc.com/pdf_20004-USPR1002Avayaweb.asp.

[27] Wall Street Journal, May 4, 2004, p. B1.

[28] pers. comm.., Jonathon Houk, Director of DHS IIAP Program, November 2003.

[29] M.E.D. Koenig, “Time Saved — a Misleading Justification for KM,” KMWorld Magazine, Vol 11, Issue 5, May 2002. See http://www.kmworld.com/publications/magazine/index.cfm.

[30] C. Phillips, “Stemming the Software Spending Spree,” Optimize Magazine, April 2002, Issue 6. See http://www.optimizemag.com/article/showArticle.jhtml?articleId=17700698&pgno=1.

[31] This average was estimated by interpolating figures shown on Figure 8 in Plumtree Corporation, “The Corporate Portal Market in 2003,” Plumtree Corp. White Paper, 30 pp. See http://www.plumtree.com/portalmarket2003/default.asp..

[32] This average was estimated by interpolating figures shown on the p.14 figure in Plumtree Corporation, “The Corporate Portal Market in 2002,” Plumtree Corp. White Paper, 27 pp. See http://www.plumtree.com/pdf/Corporate_Portal_Survey_White_Paper_February2002.pdf.

[33] Analysis based on reference 31, with interpolations from Figure 16.

[34]M. Corcoran, “When Worlds Collide: Who Really Owns the Content,” AIIM Conference, New York, NY, March 10, 2004.  See
http://show.aiimexpo.com/convdata/aiim2003/brochures/64CorcoranMary.pdf
.

NOTE: This posting is part of a series looking at why document assets are so poorly utilized within enterprises.  The magnitude of this problem was first documented in a BrightPlanet white paper by the author titled, Untapped Assets:  The $3 Trillion Value of U.S. Enterprise Documents.  An open question in that paper was why more than $800 billion per year in the U.S. alone is wasted and available for improvements, but enterprise expenditures to address this problem remain comparatively small and with flat growth in comparison to the rate of document production.  This series is investigating the various technology, people, and process reasons for the lack of attention to this problem.

Posted by AI3's author, Mike Bergman Posted on October 26, 2005 at 9:25 am in Adaptive Information, Document Assets, Information Automation | Comments (2)
The URI link reference to this post is: https://www.mkbergman.com/136/why-are-800-billion-in-document-assets-wasted-annually-iii-enterprise-solutions-are-too-expensive/
The URI to trackback this post is: https://www.mkbergman.com/136/why-are-800-billion-in-document-assets-wasted-annually-iii-enterprise-solutions-are-too-expensive/trackback/