Posted:January 31, 2007

Adopting Standardized Identification and Metadata

Since it’s becoming all the rage, I decided to go legit and get myself (and my blog) a standard ID and enable the site for easy metadata exchange.

OpenID

OpenID is an open and free framework for users (and their blogs or Web sites) to establish a digital identity. OpenID starts with the concept that anyone can identify themselves on the Internet the same way websites do via a URI and that authentication is essential to prove ownership of the ID.

Sam Ruby provides a clear article on how to set up your own OpenID. One of the listing services is MyOpenID, from which you can get a free ID. With Sam’s instructions, you can also link a Web site or blog to this ID. When done, you can check whether your site is valid; you can do a quick check using my own ID (make sure and enter the full URI!). However, to get the valid ID message as shown below, you will need to have your standard (and secure) OpenID password handy.

unAPI

unAPI addresses a different problem — the need for a uniform, simple method for copying rich digital objects out of any Web application. unAPI is a tiny HTTP API for the few basic operations necessary to copy discrete, identified content from any kind of web application. An interesting unAPI background and rationale paper from the Ariadne online library ezine is “Introducing unAPI”.

To invoke the service, I installed the unAPI Server, a WordPress plug-in from Michael J. Giarlo. The server provides records for each WordPress post and page in the following formats: OAI-Dublin Core (oai_dc), Metadata Object Description Schema (MODS), SRW-Dublin Core (srw_dc), MARCXML, and RSS. The specification makes use of LINK tag auto-discovery and an unendorsed microformat for machine-readable metadata records.

Validating the call is provided by the unAPI organization, with the return for this blog entry shown here (which is error free and only partially reproduced):

The actual unAPI results do not appear anywhere in your page, since the entire intent is to be machine readable. However, to show what can be expected from these five formats, I reproduce what the internal metadata listings for the five different formats are in these links:

MARCXML:

https://www.mkbergman.com/wp-content/plugins/unapi/server.php?id= https://www.mkbergman.com/?p=320&format=marcxml

MODS:

https://www.mkbergman.com/wp-content/plugins/unapi/server.php?id= https://www.mkbergman.com/?p=320&format=mods

OAI-DC:

https://www.mkbergman.com/wp-content/plugins/unapi/server.php?id= https://www.mkbergman.com/?p=320&format=oai_dc

RSS:

https://www.mkbergman.com/wp-content/plugins/unapi/server.php?id= https://www.mkbergman.com/?p=320&format=rss

SRW-DC:

https://www.mkbergman.com/wp-content/plugins/unapi/server.php?id= https://www.mkbergman.com/?p=320&format=srw_dc

unAPI adoption is just now beginning, and some apps like the Firefox Dublin Core Viewer add-on do not yet recognize the formats. But, because the specification is so simple and is being pushed by the library community, I suspect adoption will become very common. I encourage you to join!

Posted:January 27, 2007

Zotero is Perhaps the Most Polished Firefox Extension Yet

Zotero, first released in October, is perhaps the best Firefox extension that most users have never heard of, unless you are an academic historian or social scientist, in which case Zotero is becoming quite the rage. It is also percolating into other academic fields, including law, math and science.

Zotero is a complete research citation platform, or what its developer, George Mason University’s Center for History and New Media (CHnM), calls, “The next-generation research tool.” Zotero allows academics and researchers to extract, manage, annotate, organize, export and publish citations in a variety of formats and from a variety of sources — all within the Firefox browser, and all while obviously the user is interacting directly with the Web.

What it Is

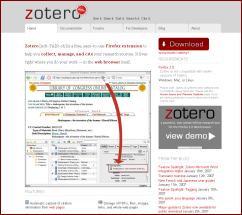
Like all Firefox extensions, Zotero is easy to install. From the Firefox add-on site or the Zotero site itself, a single click downloads the app to your browser. Upon a prompted re-start the app is now active. (Later alerts for any version upgrades are similarly automatic — as for any Firefox extension.)

Upon installation, Zotero puts an icon in your status bar and places new options on menus. When you encounter a site that Zotero supports (currently, mostly university libraries, but also Amazon and major publication outlets as well, totaling more than 150; here is a listing of Zotero’s so-called translators), you will see a folder symbol in your address bar telling you Zotero is active. A single click downloads the citations from that site automatically to your local system.

Citations have traditionally been one of the more “semantically challenging” data sets, with variations in style, order, format, presentation, coverage and you name it rampant. The fact that Zotero supports a given source site means that it understands these nuances and is ready to store the information in a single, canonical representation. Once downloaded, this citation representation can now be easily managed and organized. More importantly, you can now export this internal, standard representation into a multitude of export formats (including, most recently, MS Word). In short, like for-fee citation software in the past, Zotero now provides a free and universal mechanism for managing this chaos.

While the address icon acts to download one or more citations (yes, they also work in groups if there are multiple listings on the page!), choosing the Zotero icon itself invokes the full Zotero as an app within the browser, as this screen shot shows:

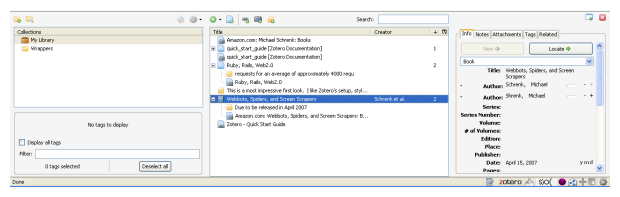
The left panes provide organization and management and tag support; the middle pane shows the active resources; and the right pane shows the structure associated with the active citation. This is all supported with attractive icons and logical tooltips and organization.

Zotero also offers utilities for creating your own scrapers (“translators”) for new sites not yet in the standard, supported roster. This capability is itself an extension to Zotero, called Scaffold, that also points to the building block nature of the core app. (Other utilities such as Solvent from MIT or others surely to come could either enhance or replace the current Scaffold framework.)

What is Impressive

Though supposedly in “beta,” Zotero already shows a completeness, sophistication and attention to detail not evident in most Firefox extensions. Indeed, this system approaches a complete application in its scope and professionalism. The fact it can be so easily installed and embedded in the browser itself is worth noting.

Firefox extensions have continuously evolved from single-function wonders to crude apps and now, as Zotero and a handful of other extensions show, complete functional applications. And, like OSes of the past, these extensions also adhere to standards and practices that make them pretty easy to use across applications. Firefox is indeed becoming a full-fledged platform.

This system is also using the new SQLite local database function (“mozStorage”) in Firefox 2.x to manage the local data (perhaps one of the first Firefox extensions to do so). This provides a clean and small install footprint for the extension, as well as opens it up to other standard data utilities.

What it Implies

So, what Zotero is exemplifying — beyond its own considerable capabilities — are some important implications. First, full-bodied apps, building on many piece-parts, can now be expected around the Fireflox platform. (Indeed, I earlier noted the emergence of such “Web OS” prospects as Parakey, whose developers also come from earlier Firefox legacies. One of those developers, Joe Hewitt, is also the author of the impressive Firebug extension.)

Second, the openness of Firefox for web-centric computing will, as I’ve stated before, continue to put competitive pressure on Microsoft’s Internet Explorer. This is good for all users at large and will continue to spur innovation.

Third, the pending version 2.0 of Zotero is slated to have a server-side component. What we are potentially seeing, then, are local client-side instantiations in the browser that can then communicate with remote data servers. This opens up a wealth of possibilities in social networking and collaboration.

And, last, and more specific to Zotero itself (but also enabled with Firefox’s native RDF support), we are now seeing a complete app framework for dealing with structured information and tagging on the Web. While clearly Zotero has a direct audience for citation management and research, the same infrastructure and techniques used by the system could become a general semantic Web or data framework for any other structured application.

Hmmm. Now that sounds like an opportunity . . . .

Jewels & Doubloons An AI3 Jewels & Doubloon Winner
Posted:January 24, 2007

Structure for the Masses

or

Instant Mashups between WordPress, Google Spreadsheets and Exhibit

The past couple of days has seen a flurry of activity and much excitement revolving around a new “database-free” mashup and publication system called Exhibit. Another in a string of sneaky-cool software from MIT’s Simile program (and written by David Huynh, a pragmatic semantic Web developer of the first order), Exhibit (and its sure to follow rapid innovations) will truly revolutionize Web publishing and the visualization and presentation of structured data. Exhibit is quite simply “structure for the masses.”

What is It?

With just a few simple steps, even the most novice blog author can now embed structured data — such as sortable and filtered table displays, thumbnails, maps, timelines and histograms — in her blog posts and blog pages. Using Exhibit, you can now create rich data visualizations of web pages using only HTML (and optional CSS and Javascript code).

Exhibit requires no traditional database technology, no server-side code, and no need for a web server. Here is a sampling of Exhibit‘s current capabilities:

  • No external databases or hassles
  • Data filtering and sorting
  • Simple HTML embeds and calls
  • Automatic and dynamic page layouts and results rendering
  • Completely tailorable (with CSS and Javascript)
  • Direct updates and presentations (mashups) from Google spreadsheets
  • Pre-prepared timelines, map mashups, tabular display options, and Web page formatting
  • Easily embedded in WordPress blogs (see the first tutorial here).

Exhibit is as simple as defining a spreadsheet; after that you have a complete database! And, if you want to get wild and crazy with presentation and display, then that is easy as well!

What Are Some Examples?

Though Exhibit has been released barely one month, already there are some pretty impressive examples:

What Are People Saying?

Granted, we’re only talking about the last 24 hours or so, but interesting people are noticing and commenting on this phenomenon:

  • Ajaxian“Exhibit is a new project that lets you build rich sorting and filtering data applications in a simple way.”
  • Danny Ayers“Although the person using these tools doesn’t need to think about gobbledegook like RDF, when they use the tools, they are putting first class data on the web in a Semantic Web-friendly fashion.”
  • David Huynh“Now, we’re not just talking about the usual suspects of domains like photos and bookmarks. We’re talking about any arbitrary domain of data — Yes, the real world data. The data that people care about. I am hoping that we can create tools that let the average blogger easily publish structured data without ever having to coin URIs or design or pick ontologies — But there it is: this is, in my humble opinion, a beginning of something great.”
  • Kyler “If you don’t see the value of this, you are a fool.”
  • Derek Kinsman“Exhibit is an amazing web app … I am beginning to work alongside my WordPress mates in the hopes that we can create some sort of Administration area inside WordPress that connects to the Google accounts. Right inside WP. Also, we’re attempting to create some sort of plugin or downloadable template to which Exhibit can run mostly out of the box.”

What is Coming?

Johan Sundström has created an Instant Google Spreadsheets Exhibit, which lets you turn any Google spreadsheet (with certain formatting requirements) into an “exhibit” just by pasting in its public feed URL with immediate faceted browsing; maps and timelines are forthcoming.

Well, a WordPress plug-in is in the works (to be announced, with Derek helping to take the lead on it). Though incorporation into a blog is easy, it does require the author to have system administration rights and access to the WordPress server. A plug-in could remove those hurdles and make usage still easier.

Exhibit‘s very helpful online tutorials are being expanded, particularly with more examples and more templates. For those seriously interested in the technology, definitely monitor the Simile project site.

There continues to be activity and expansion of the Babel translation formats. You can now convert BibTeX, Excel, Notation 3 (N3), RDF/XML or tab-separated values (TSV) to a choice of Exhibit JSON , N3 or RDF/XML. And, since Exhibit itself internally stores its data representation as triples, it is tantalizing to think that another Simile project, RDFizers, with its impressive storehose of RDF converters, may also be more closely tied with Babel. Is it possible that Exhibit JSON may become the lingua franca of small-scale data representation formats?

And, within the project team of Huynh and his Ph.D. thesis advisor, David Karger, there are also efforts underway to extend the syntax and functionality of Exhibit. We’ve just seen the expansion to direct Google spreadsheet support, and support for more spreadsheet functionality is desired, including possible string concatenation and numeric operations.

Exhibit itself has been designed with extensibility in mind. Its linkage to Timeline, for example, is one such example. What will be critical in the weeks and months ahead is the development of a developer and user community surrounding Exhibit. There is presently a fairly active mailing list and I’m sure the MIT folks would welcome serious contributions.

Finally, other aspects of the Simile project itself and related intiatives at MIT have direct and growing ties to Exhibit both in terms of team members and developers and in terms of philosophy. You may want to check out these additional MIT projects including Longwell, Piggy Bank, Solvent, Semantic Bank, Welkin, DSpace, Haystack, Dwell, Ajax, Sifter, Relo plugin, Re:Search, Chickenfoot, and LAPIS. This is a program on the move, to which the closest attention is warranted.

Expected Growing Pains

There are some known issues sometimes with display in Safari and Opera browsers; these are being worked on and should be resolved shortly. There are also some style issues and conflicts when embedding in blogs (easily fixed with CSS modifications). There are likely performance problems when data sets get into the hundreds or thousands, but that exceeds Exhibit‘s lightweight objectives anyway. There may be other problems that emerge as use broadens.

These issues are to be expected and should not diminish playing with the system immediately. You’ll be amazed at what you can do, and how rapidly with so little code.

It has been a fun few days. It’s exciting to be able to be a camp follower during one of those seminal moments in Web development. And, so I say to David and colleagues at MIT and the band of merry collaborators on their mailing list: Thanks! This is truly cool.

Jewels & Doubloons An AI3 Jewels & Doubloon Winner
Posted:January 22, 2007

Five Easy Steps to Embed Exhibit in a Blog

My earlier post gushed about the new Exhibit lightweight, structured data publishing system for Web pages from MIT’s Simile project. Because I was so impressed with the project’s examples, I decided to convert my existing 350+ semantic Web tools listing, Sweet Tools, to an online database. I also wanted to maintain the Google spreadsheet listing for others to make new tools suggestions.

Please see the NEW and IMPROVED Sweet Tools here, and now in database format! (And now updated to 378 tools!)

The remainder of this posting describes how I did this, following the online Exhibit tutorials. To my knowledge, this is the first time that an “exhibit” has been embedded within a blog system (WordPress in my example).

Five Easy Steps

  1. Though one can start with a standalone spreadsheet or other simple data structure, I began with a Google online spreadsheet (of the 350+ tools). I only needed to make a few changes in terms of {bracket identifiers} as column heads and to make explicit some other data features (such as ‘new’) that I had been handling before as formatting (see tutorials below). (I should mention that Exhibit seems to handle OK datasets as large as the one used here.) If you have a Google account, you can see the original, older version of the spreadsheet (which will no longer be updated or maintained) with its slightly modified new Google sibling
  2. I then followed the excellent “Getting Started” Exhibit tutorial, making all modifications locally. I worked with this local system until I got the display and presentation working the way I wanted it to with the various styles (I also decided to add thumbnails at this point; see thumbshots.org for examples and code)
  3. Within WordPress I created a new page template, in which I embedded the Javascript, the body onLoad call, and the embedded table as described above in Step 2. IMPORTANT: You need to have system administration access to WordPress to make these modifications; hosted services might be difficult. IMPORTANT: Though not indicated in any of the tutorials, I also had to embed references to the Exhibit style sheets in the page template, since my existing blog styles were apparently not allowing the inheritance of the remote Exhibit styles. (I also chose to embed my local styles via link reference as well.) Please copy these references carefully! Thus, the top of my page template (with differences shown in bolded maroon) became:
  4. Then, via the Write Page function within the WordPress admin center, I created a new page post referencing this new page template. I embedded some lead-in paragraphs in the page itself (but that is not necessary), and
  5. Finally, I updated my local spreadsheet (and will continue to do so periodically), uploaded it to Google, and made sure that I removed any extraneous rows and columns from the data to be displayed. Then, I manually re-published the site, and published it, again according to the excellent Exhibit tutorial on working with Google spreadsheets, and viola!

General Observations

The remote data feed from Google spreadsheets is a very nice feature that also removes one further step from the standard (though simple!) Exhibit set-up.

You can used mixed case in your attribute descriptors (but no spaces!) for better label displays (such as capitalization). However, for some reason (I suspect it’s an early bug) you can not use mixed case on the first Google field, which also defaults to “label”.

The remote Exhibit styles should probably be called out separately and better commented. I’m still seeing some squirrelly styles behavior. (For example, the right-margin browse and filter selection box has some overlapping characters.) Though I can inspect the styles with tools like Web Developer, it is tricky to make local changes.

Like Tim Isenheim’s Timeline plug-in for WordPress, it probably makes sense for someone with PHP experience (not me!) to make an Exhibit plug-in as well.

Lastly, the existing Exhibit tutorials are very helpful, but more would also help. (Hint, hint David!) More examples of filtering, lenses, and layout templates would be especially helpful.

However, the most important observation is that Exhibit is a much more useful and flexible presentation format than simple spreadsheets. Though as a first-time experience it took me some trial-and-error to work out the details, it is really very easy and straightforward to add such capabilities to a WordPress blog.

MIT’s Exhibit Continues the Simile Project’s Long String of Innovative Tools

I have just come across a new innovative Web development, and its simplicity and elegance have literally taken my breath away! Exhibit, from the Simile project at MIT and its lead author David Huynh, whose contributions include the stellar Piggy Bank (semantic Web Firefox extension), Sifter (little known, but excellent automatic Web data extractor), Babel (data format translator), Timeline (Javascript timeline creator), Ajax (toolset), Solvent (Web data extractor used by Piggy Bank) and Longwell (web-based RDF-powered faceted browser). David is the lead author on the first five tools listed. As a Ph.D. student at MIT, David is truly becoming one of the leading lights in practical semantic Web tool development. Exhibit only reinforces that reputation.

According to its Web site:

Exhibit is a lightweight structured data publishing framework that lets you create web pages with support for sorting, filtering, and rich visualizations by writing only HTML and optionally some CSS and Javascript code.

It’s like Google Maps and Timeline, but for structured data normally published through database-backed web sites. Exhibit essentially removes the need for a database or a server side web application. Its Javascript-based engine makes it easy for everyone who has a little bit of knowledge of HTML and small data sets to share them with the world and let people easily interact with them. . . .

“No Database, No Web Application” means that you can create your own exhibits using just a text editor. . . It’s quite easy to make exhibits. We even let you copy data straight out of a boring spreadsheet and convert it into an exhibit automatically. . . .

Exhibit consists of a bunch of Javascript files that you include in your web page. At load time, this Javascript code reads in one or more JSON data files that you link from within your web page and constructs a database implemented in Javascript right inside the browser of whoever visits your web page. It then dynamically re-constructs the web page as the visitor sorts and filters through the data. . . .

The advantages of Exhibit are as follows:

  • No traditional database technology involved even though Exhibit-embedding web pages appear as if they are backed by databases. So you don’t have to design any database, configure it, and maintain it. After all, if you only have a few dozens of things to publish rather than thousands, why would you spend so much effort in dealing with database technologies?
  • No server-side code required even though Exhibit-embedding web pages are heavily templated. So, there is no need to learn ASP, PHP, JSP, CGI, Velocity, etc. There is no need to worry which server-side scripting technology your hosting provider supports.
  • No need for web server if you only want to create exhibits and keep them on your own computer for your own use. They work straight from the file system.

We also provide a complementary service called Babel that lets you convert data from various sources, including tab-separated values (copied straight from spreadsheets) and Bibtex files, into formats that Exhibit understands.

The Exhibit Web site offers a growing list of helpful tutorials and some live examples of database-related “exhibits,” one of which is this U.S. Presidents’ example that shows maps, timelines, thumbnails and other nifty displays (see the actual site for the interactive displays):

You can get Exhibit today and embed it in your own Web site (more on this to come!).

To learn more about the background to this project, please see the submitted paper, Exhibit: Lightweight Structured Data Publishing, submitted to WWW, 2007, by David Huynh, Robert Miller, and David Karger.

Gentlemen, on behalf of the community, let me say, “Thanks! Most excellent work!” It’s discoveries like these that make the Internet so worthwhile.